Let's take a look right now.
Analyzing charts before making investment decisions is a good habit. We do not insist. Try it out thoroughly and decide when you feel it helps you.
Technical Chart Analysis Academy
Take a look at the documentation on technical chart analysis.
Start LearningService Tour
(Video/User Guide)
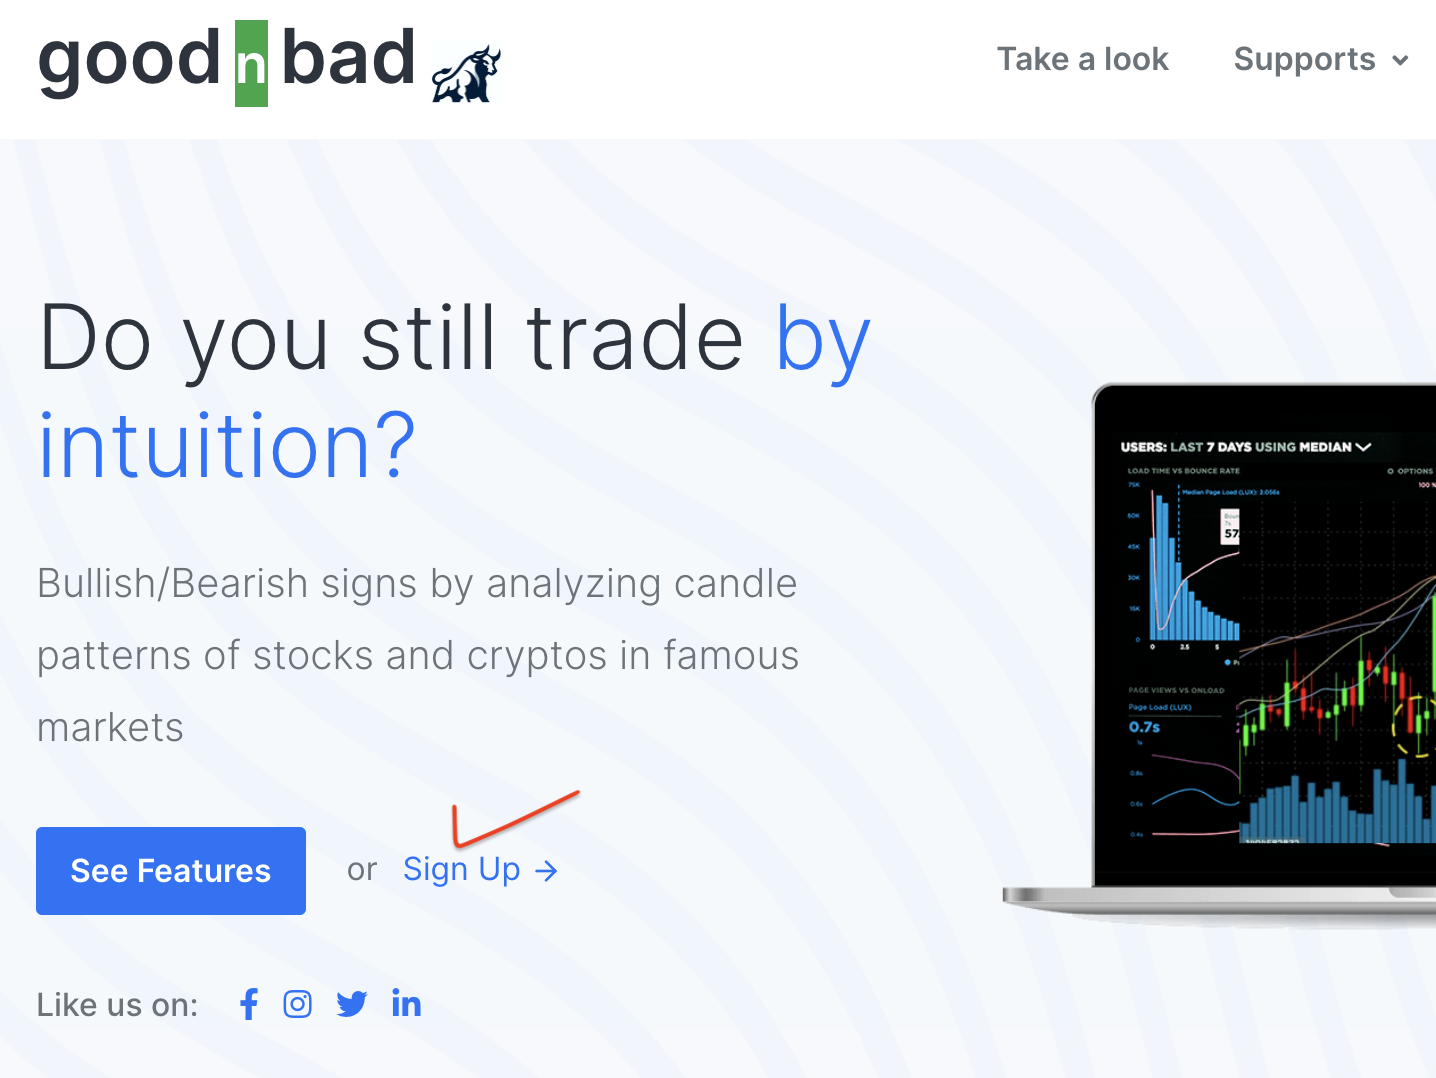
Sign Up (FREE)
Decide on Premium!
Take a Look.
Explore the service with videos or user guides and sign up for free.
 for General user
for Premium user
User Guide
Sign Up
You can quickly explore as a guest user by clicking the 'Guest Login' button on this screen or the Home screen, but access may be interrupted due to many users logging in simultaneously. It is insufficient for continuous use. Try signing up for a free membership. You can use general features except for premium features.
(Guest service was discontinued as of July 1, 2024.)
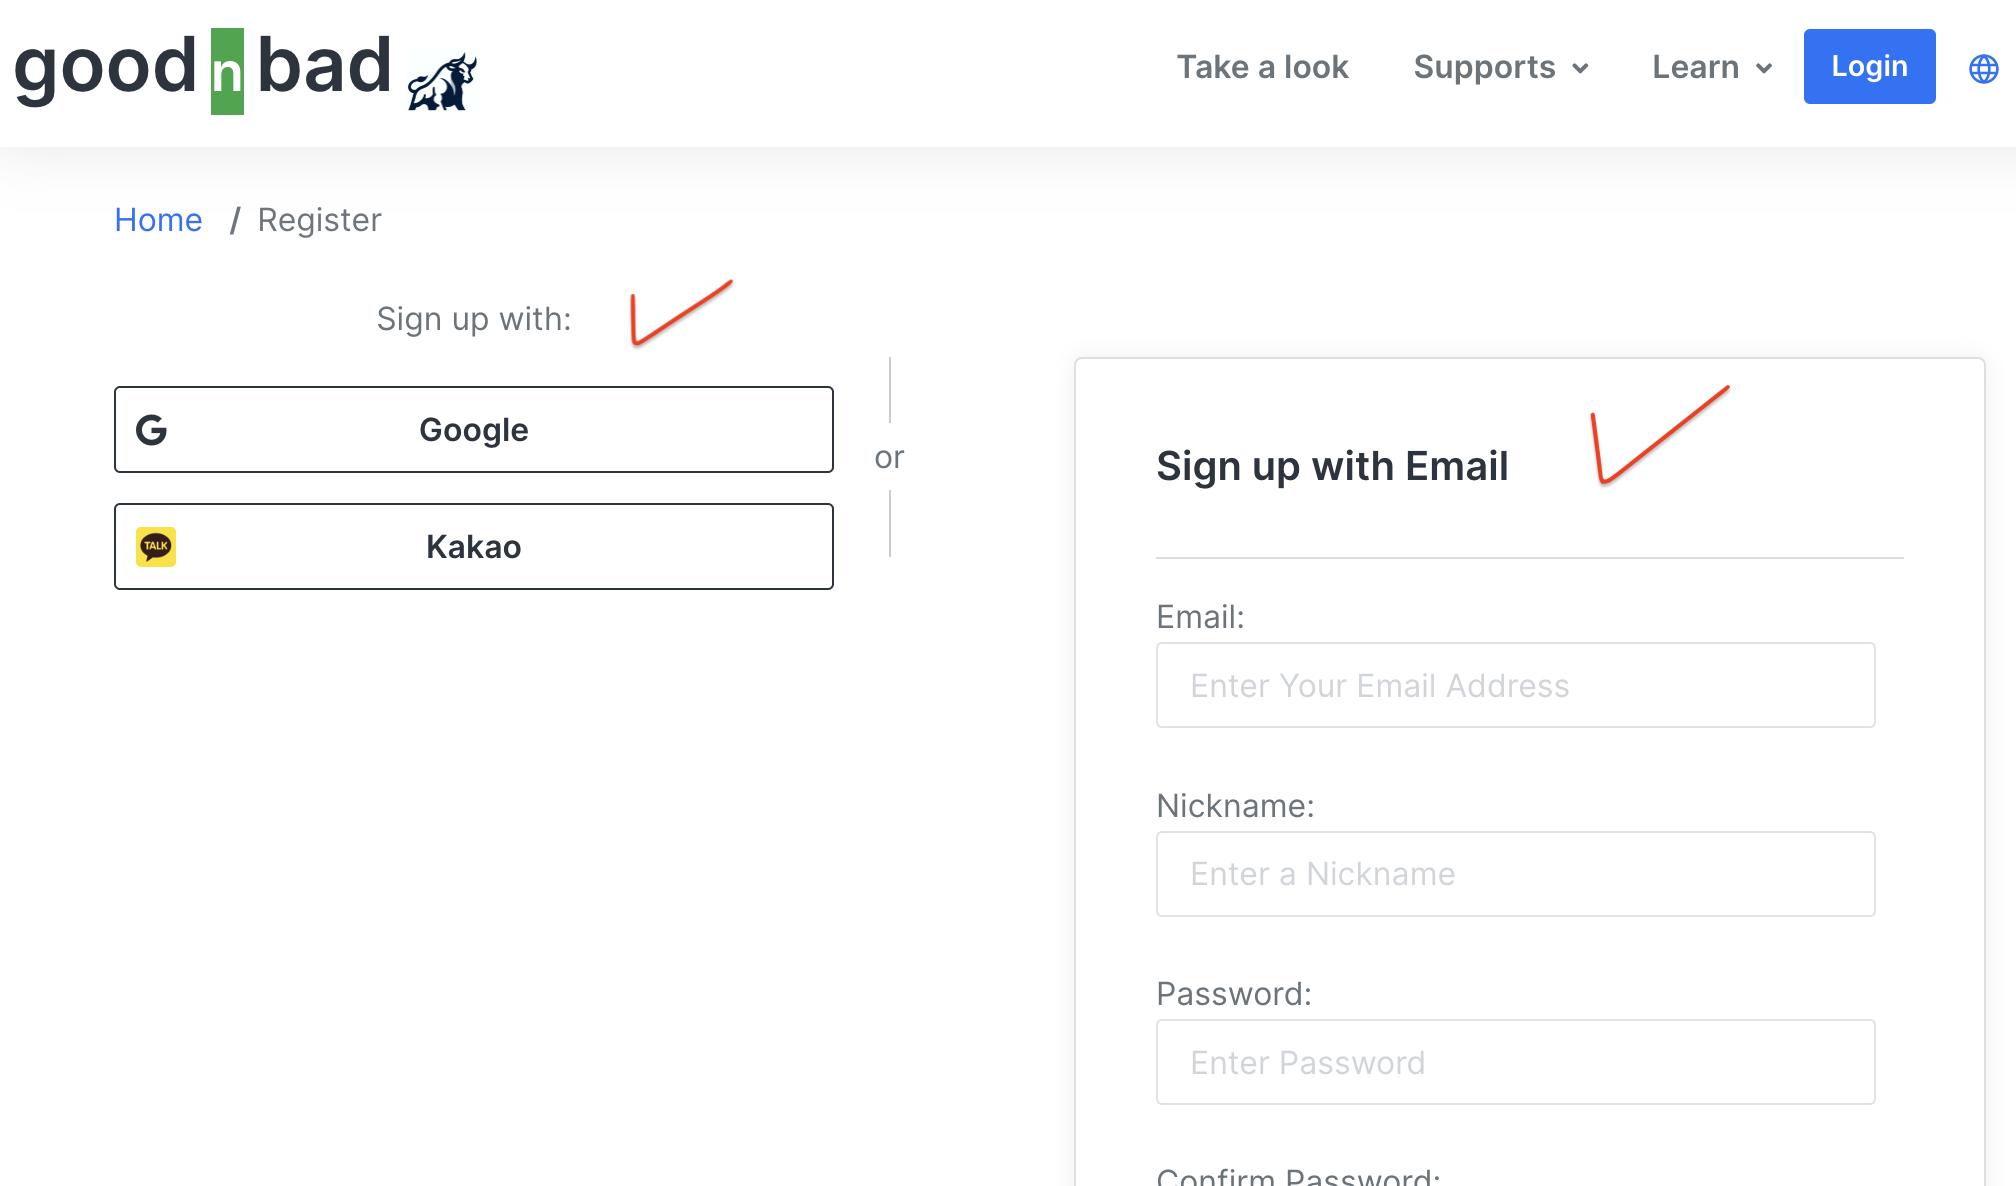
You can easily sign up and log in using OAuth2 authentication such as Google or Kakao. You can also sign up by directly entering your email/nickname/password. The nickname/password can be modified at any time after logging in.
Register
Select the 'Charts Analysis' Menu
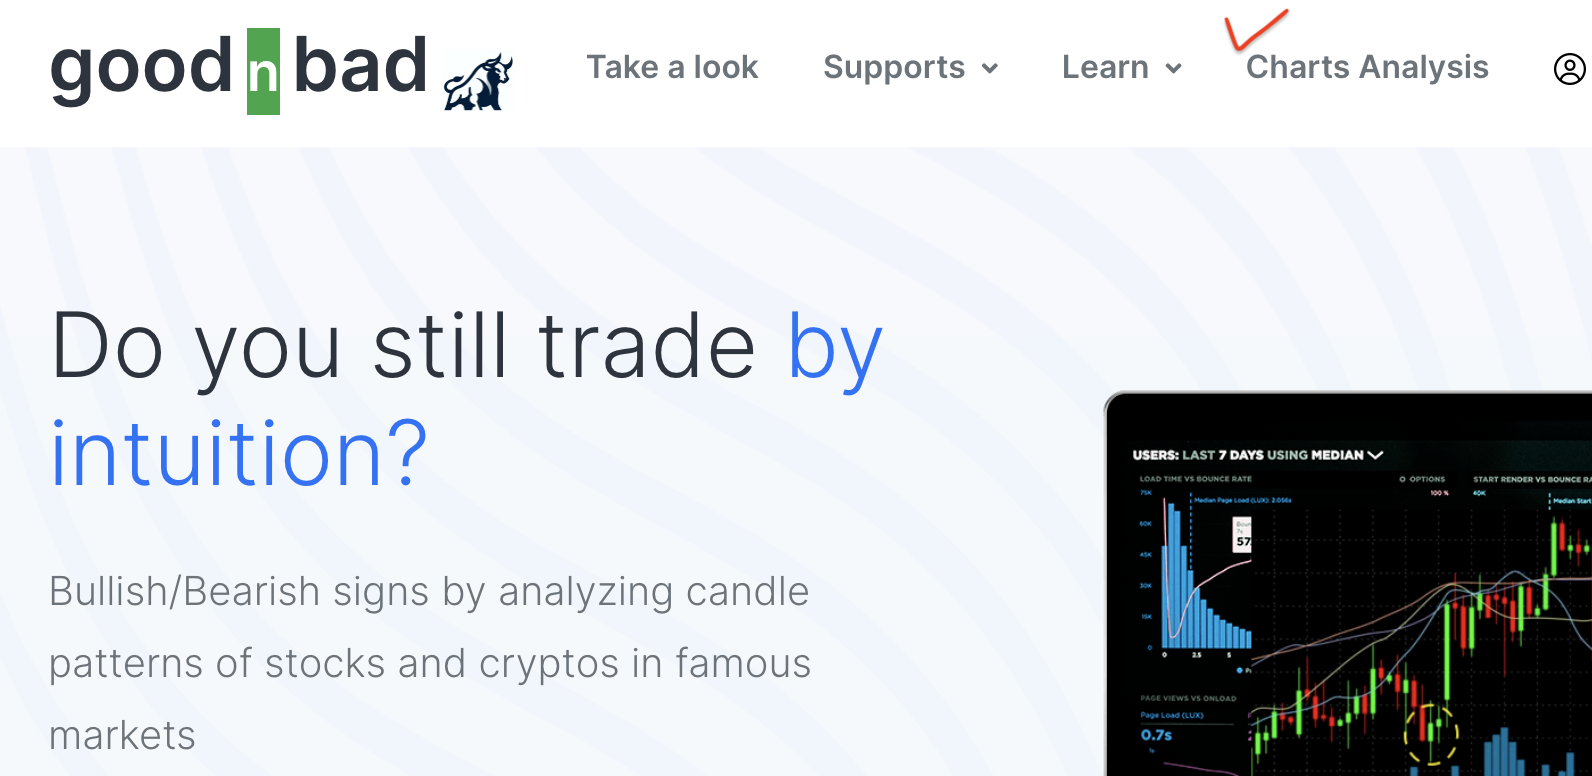
After logging in, you will automatically move to the chart pattern detection screen as shown below. If you are on a different screen, you can also move to the chart pattern detection screen by clicking the 'Charts Analysis' menu on the top menu bar. However, if you do not log in, the 'Charts Analysis' menu will not be visible.
After logging in, you can see the 'Chart Pattern Detection and Chart Analysis' page on the side screen. The 'Chart Pattern Detection' screen has a 'Step-by-Step Page' screen that anyone can easily follow step by step and an 'Advanced Page' screen that you can use more efficiently on a single screen. You can use the screen you are comfortable with, and the functions are the same. However, for both methods, the features provided are limited depending on the Guest/Standard (Free)/Premium account.
Chart Pattern Detection and Chart Analysis Screen
Step-by-Step Screen Composition
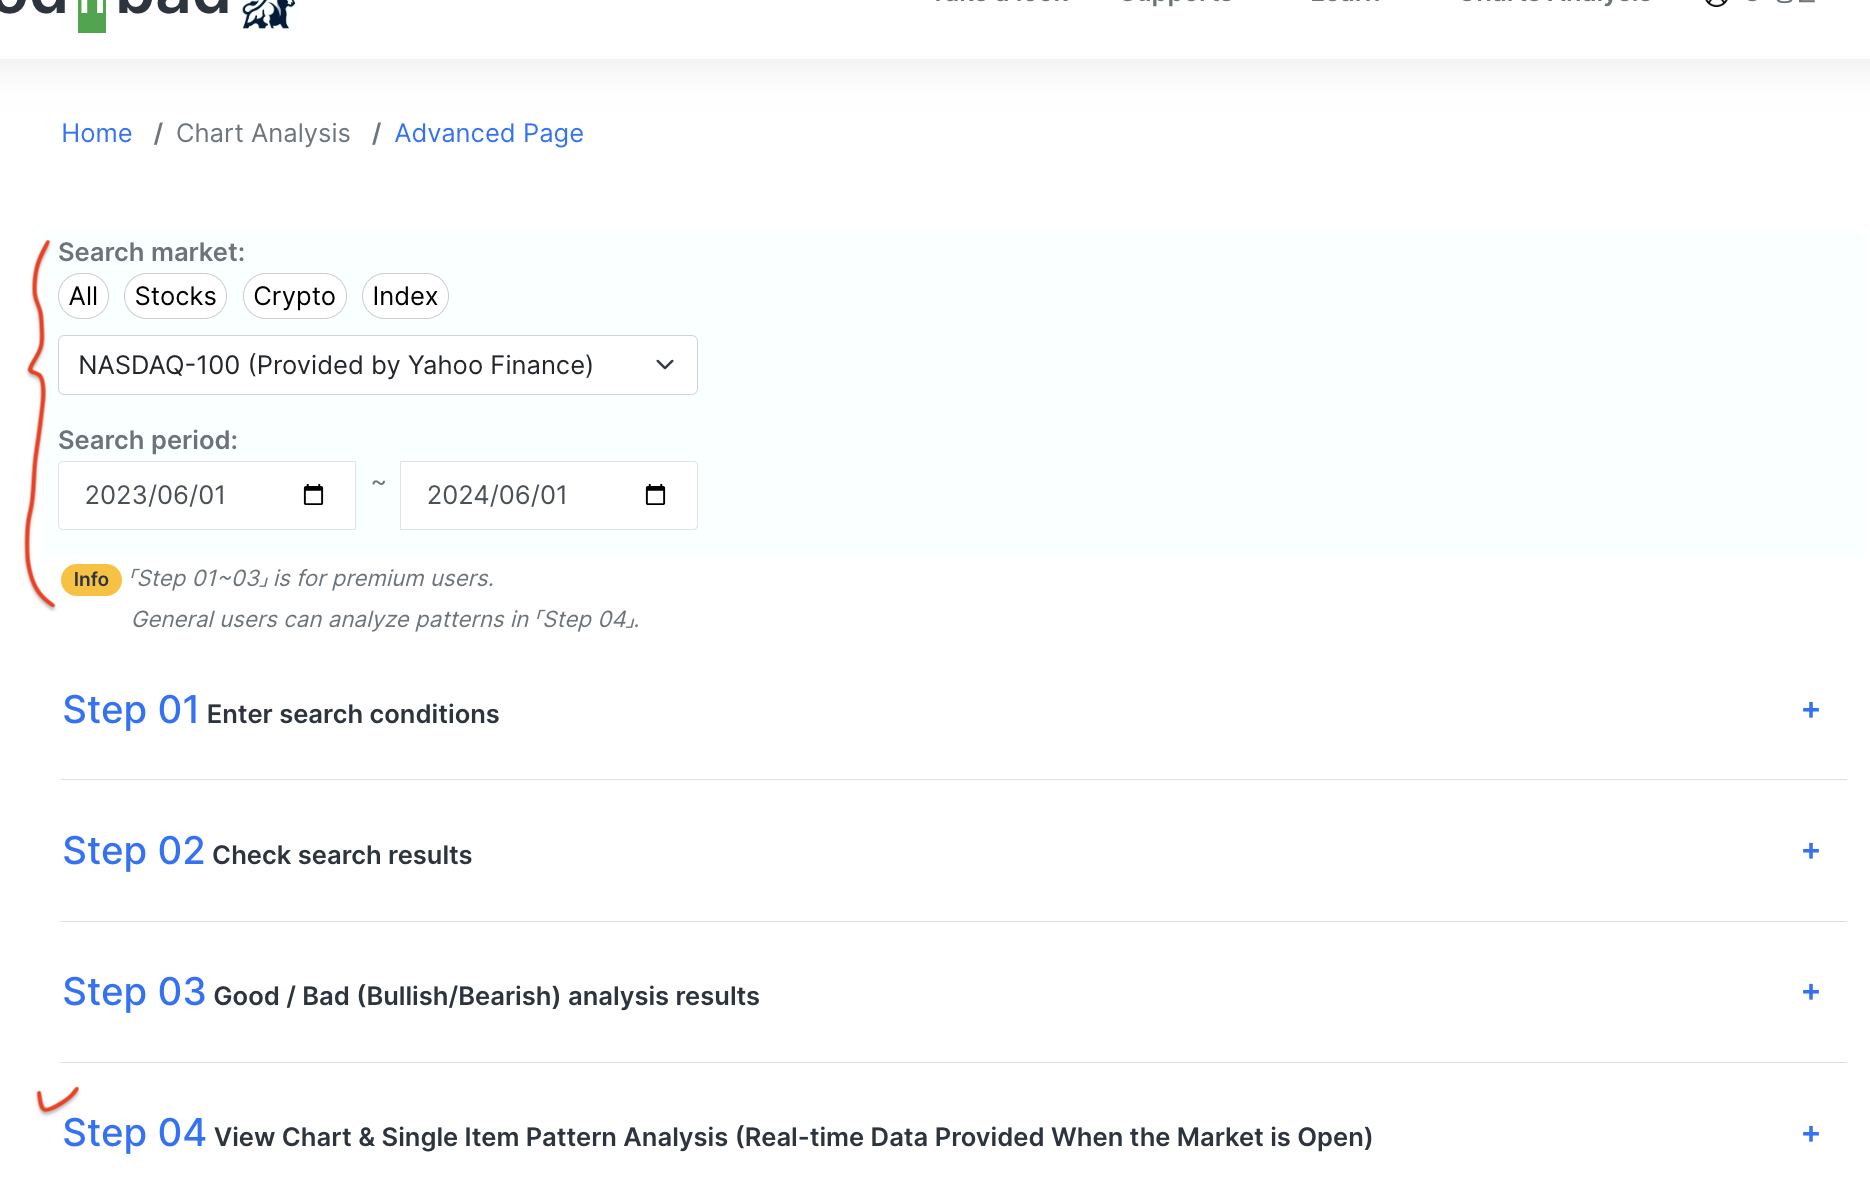
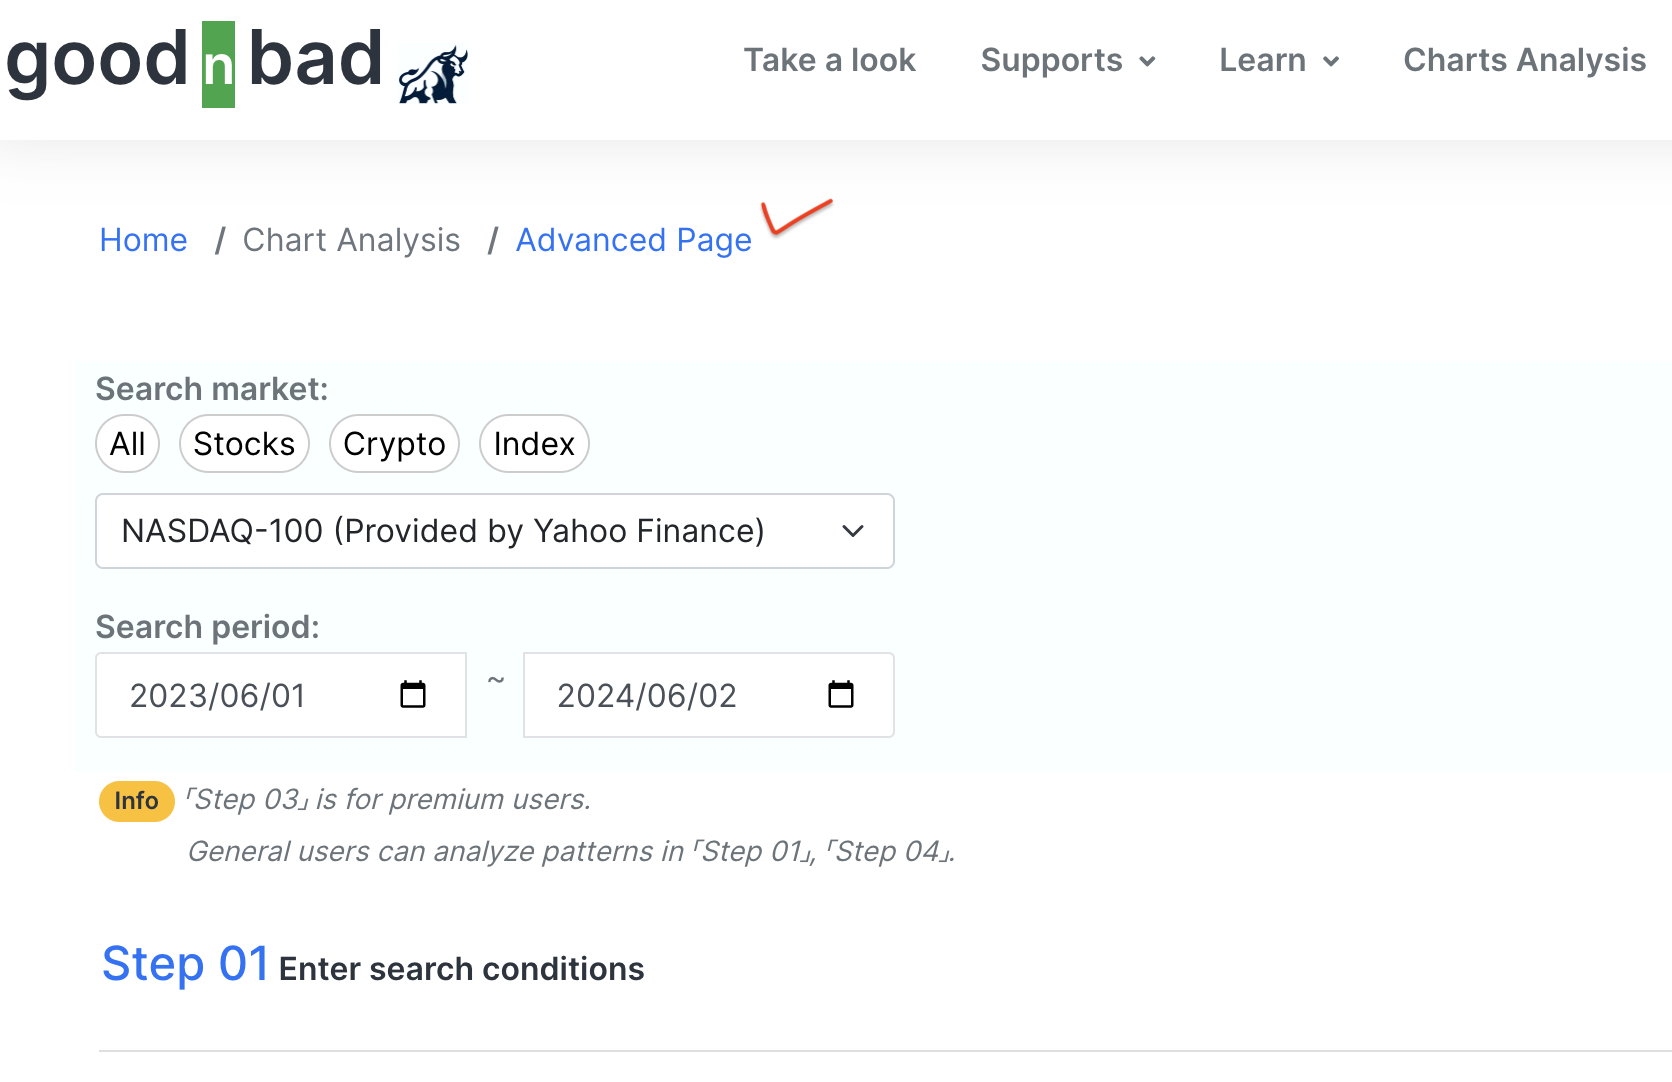
The Step-by-Step screen consists of a part where you select the search market and search period at the top of the screen, and steps 'Step 01', 'Step 02', 'Step 03', 'Step 04'. By clicking the text of each step, the screen of that step unfolds.
'Step 03' is only provided to premium users. General users can search for items in 'Step 01' or click 'Step 04' to detect chart patterns and analyze charts with a single item only.
General users can view the screens by clicking each step, but the buttons are disabled. General users should select the search market and search period at the top of the screen, then click 'Step 04'. (Refer to the 'Step 04' screen guide.)
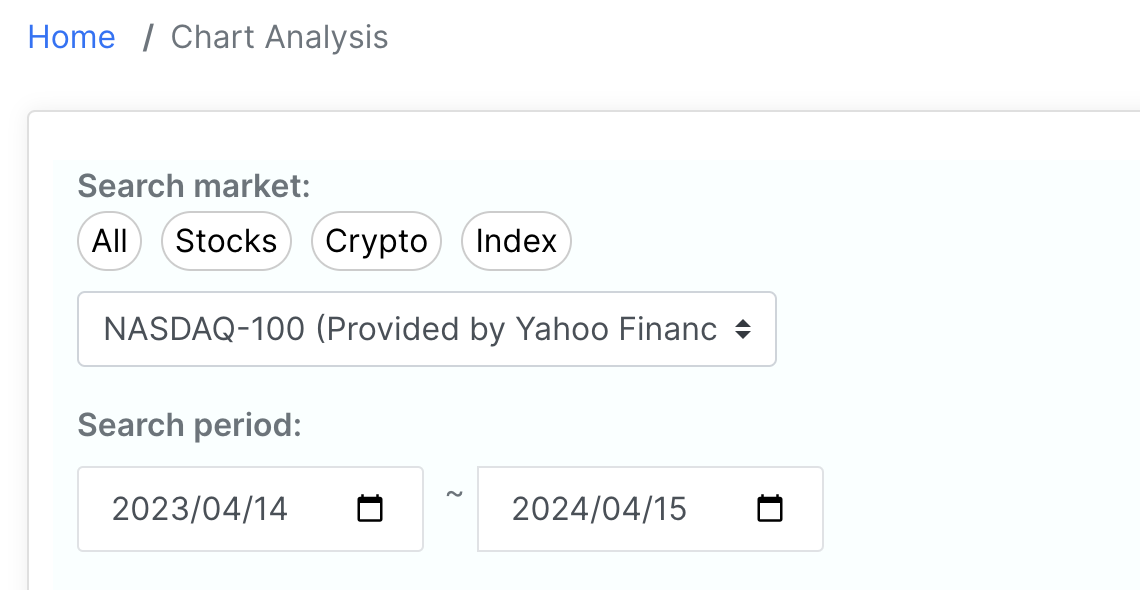
The 'end date' of the search period is important because it is the reference date for chart pattern detection. Pattern detection is based on the end date.
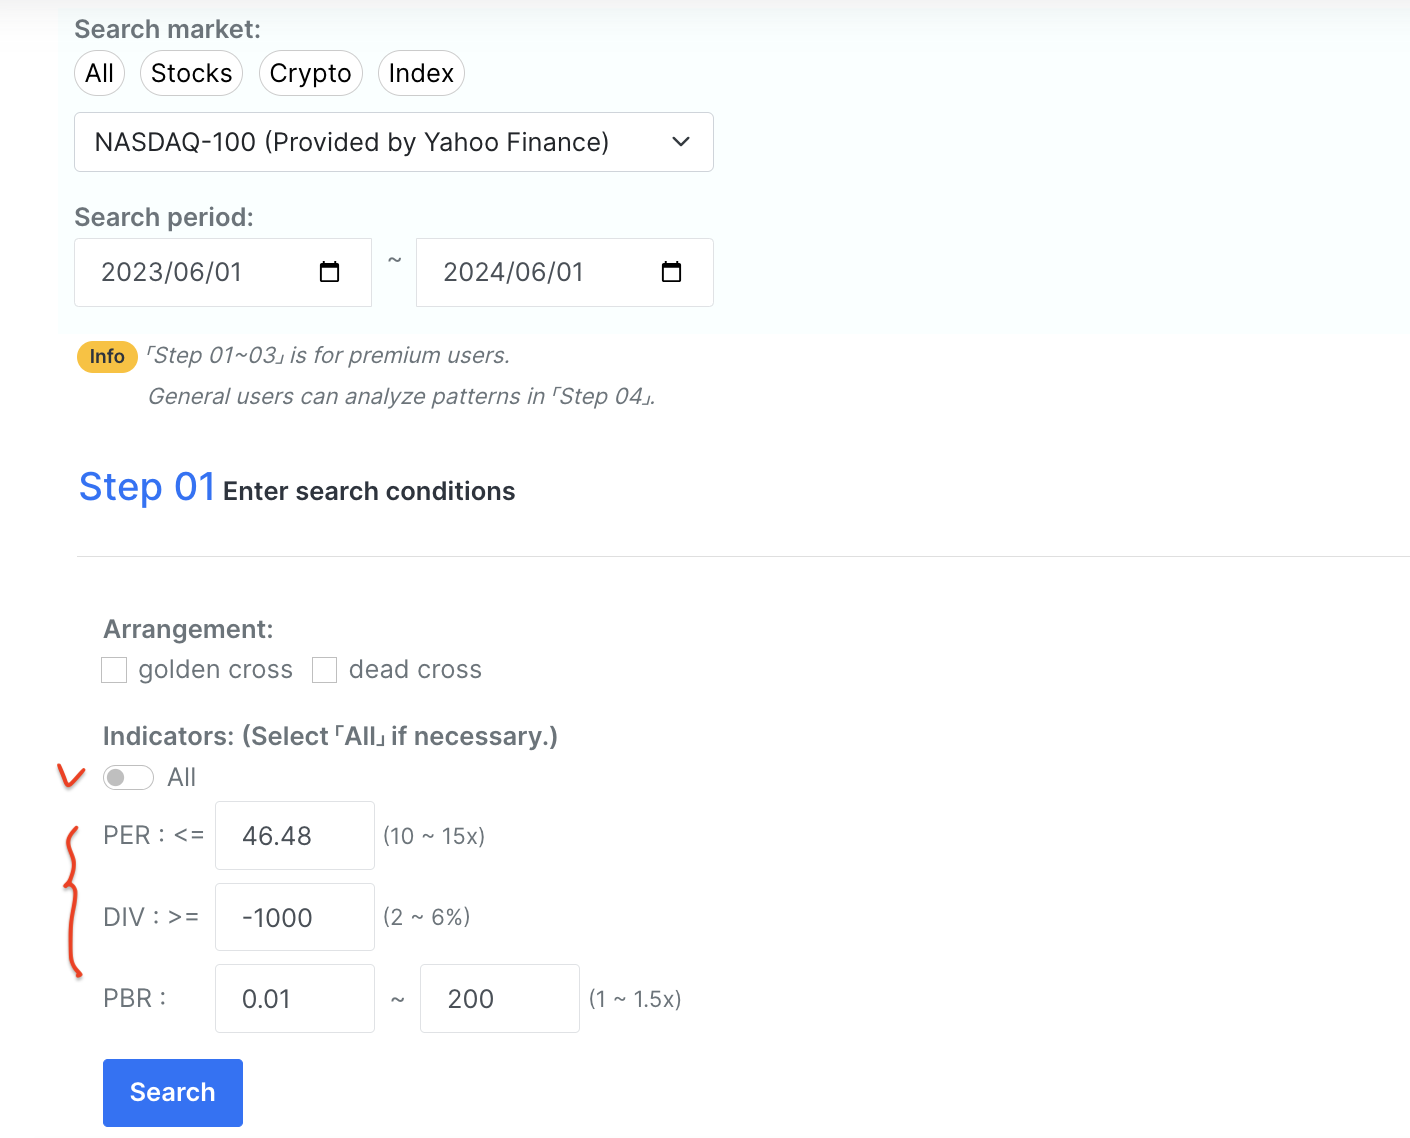
This screen is where you enter search conditions to select items for chart pattern detection.
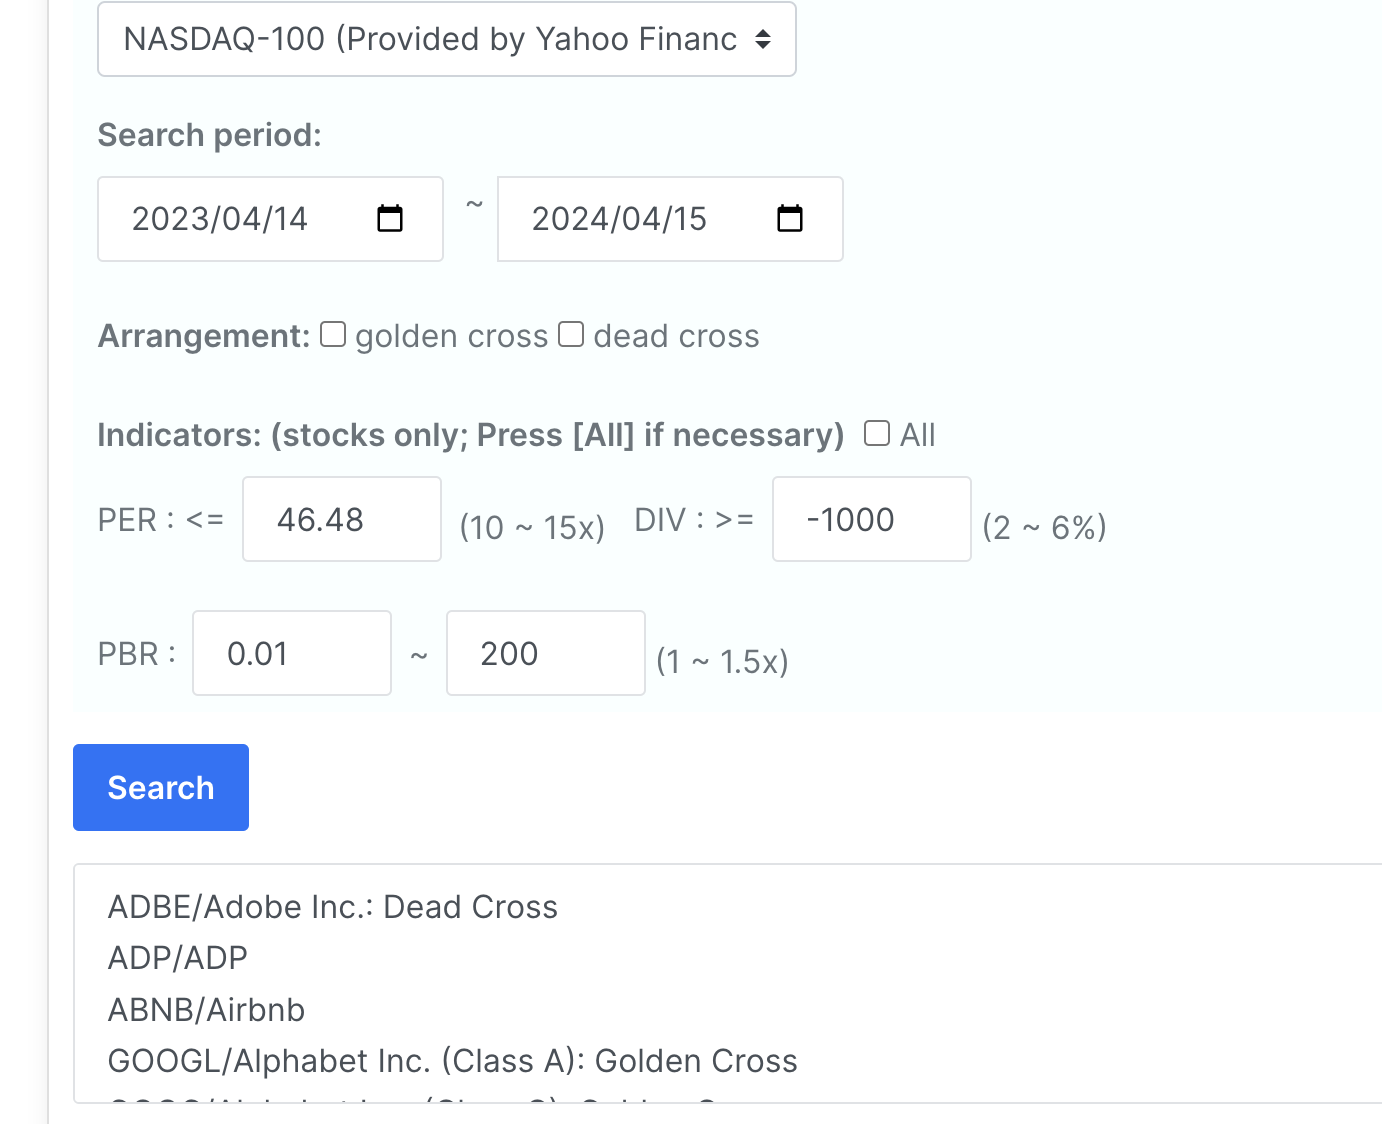
You can select 'Golden Cross', 'Dead Cross' as the 'array state' of the item, or you can choose not to select any, or you can select all.
For stocks, you can select the range of indicators such as PER, DIV, PBR.
Although the indicator ranges are given by default, you can specify the desired range. '<=' means 'less than or equal to' the specified value and '>=' means 'greater than or equal to' the specified value.
Although appropriate ranges for each indicator are guided, appropriate ranges may differ depending on the market.
If the desired item is not found in the stock market, select 'All' for the indicator.
The 'indicators' are only visible in the stock market and not in the cryptocurrency market.
After entering the search conditions, click the 'Search' button to automatically unfold the 'Step 02' screen, displaying the items matching the search conditions. If 'Step 02' does not unfold automatically,
click 'Step 02' or check for an 'error message' at the top of the screen.
To enhance 'security', a message may appear at the top of the screen after a certain period to prompt you to log in again.
- PER (Price-to-Earnings Ratio): The value obtained by dividing the stock price by the earnings per share. Evaluates the profitability of the stock.
- DIV (Dividend): Dividend amount or dividend yield. Profits distributed to shareholders.
- PBR (Price-to-Book Ratio): The value obtained by dividing the stock price by the book value per share. Evaluates the asset value of the stock.
Step 01: Enter Search Conditions
Step 02: Check Search Results
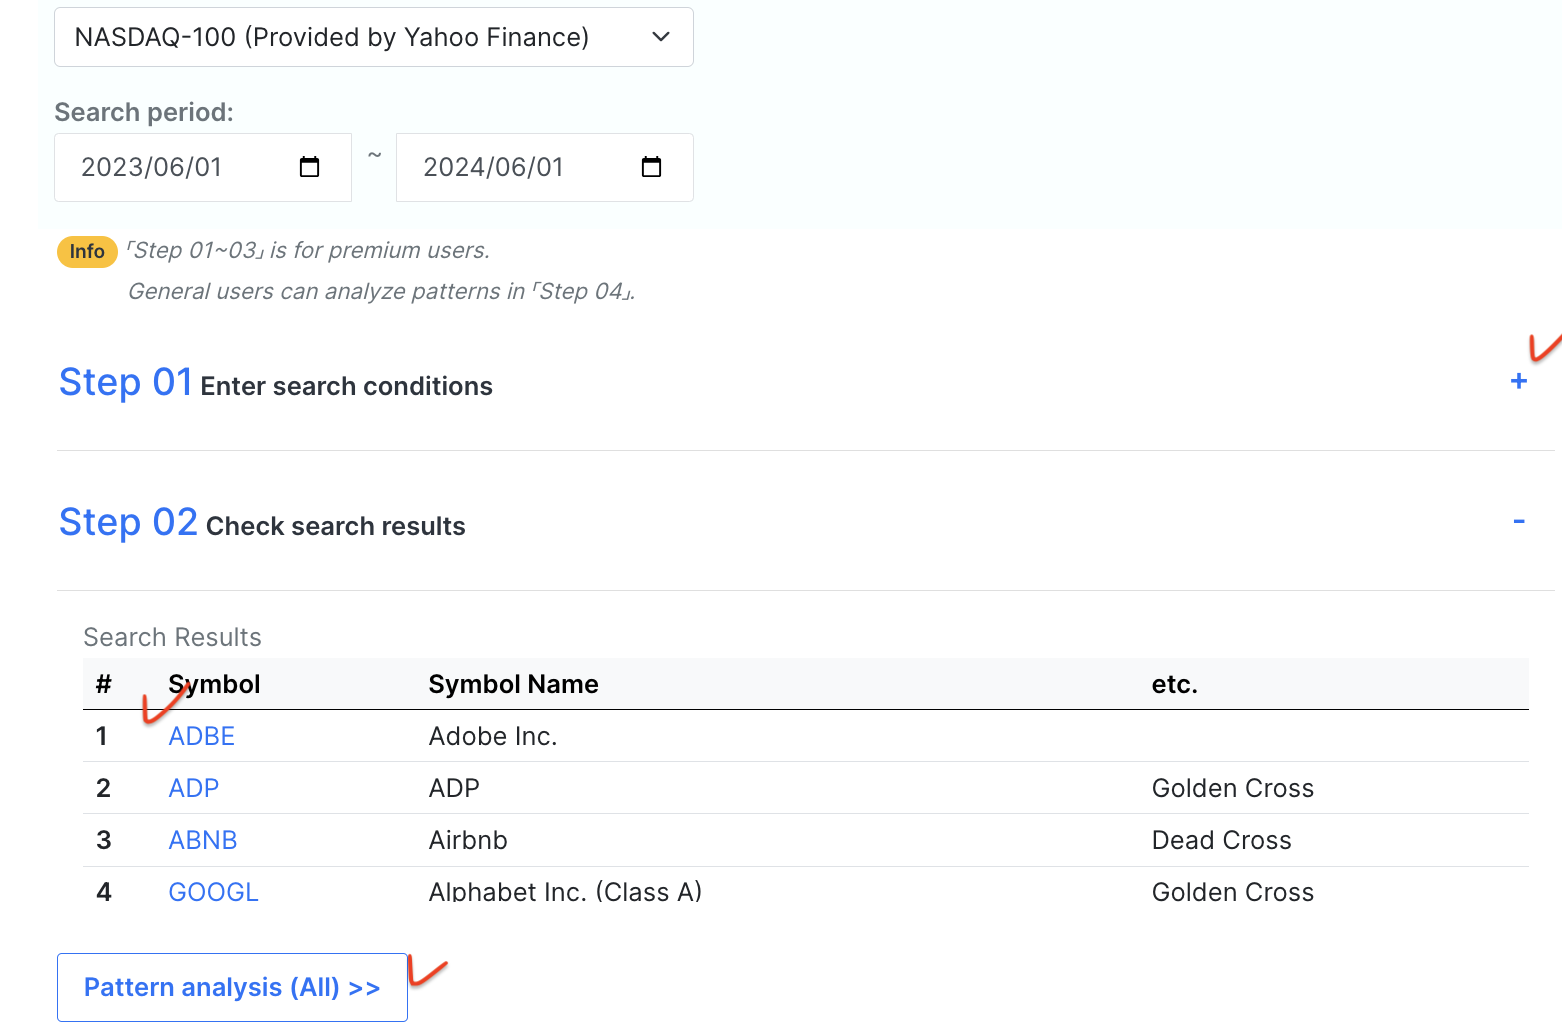
This screen displays the items matching the search conditions from 'Step 01'.
The items are listed in a table format, and scrolling up and down will show more items.
If there are items that match the search conditions, clicking the 'Symbol' of the item will automatically unfold the 'Step 04' screen, moving to the 'Candle Chart' of that item. (Refer to the 'Step 04' screen guide.)
If no items matching the search conditions are displayed, click the text of 'Step 01' or the '+' sign of 'Step 01' to re-enter the search conditions and try searching again.
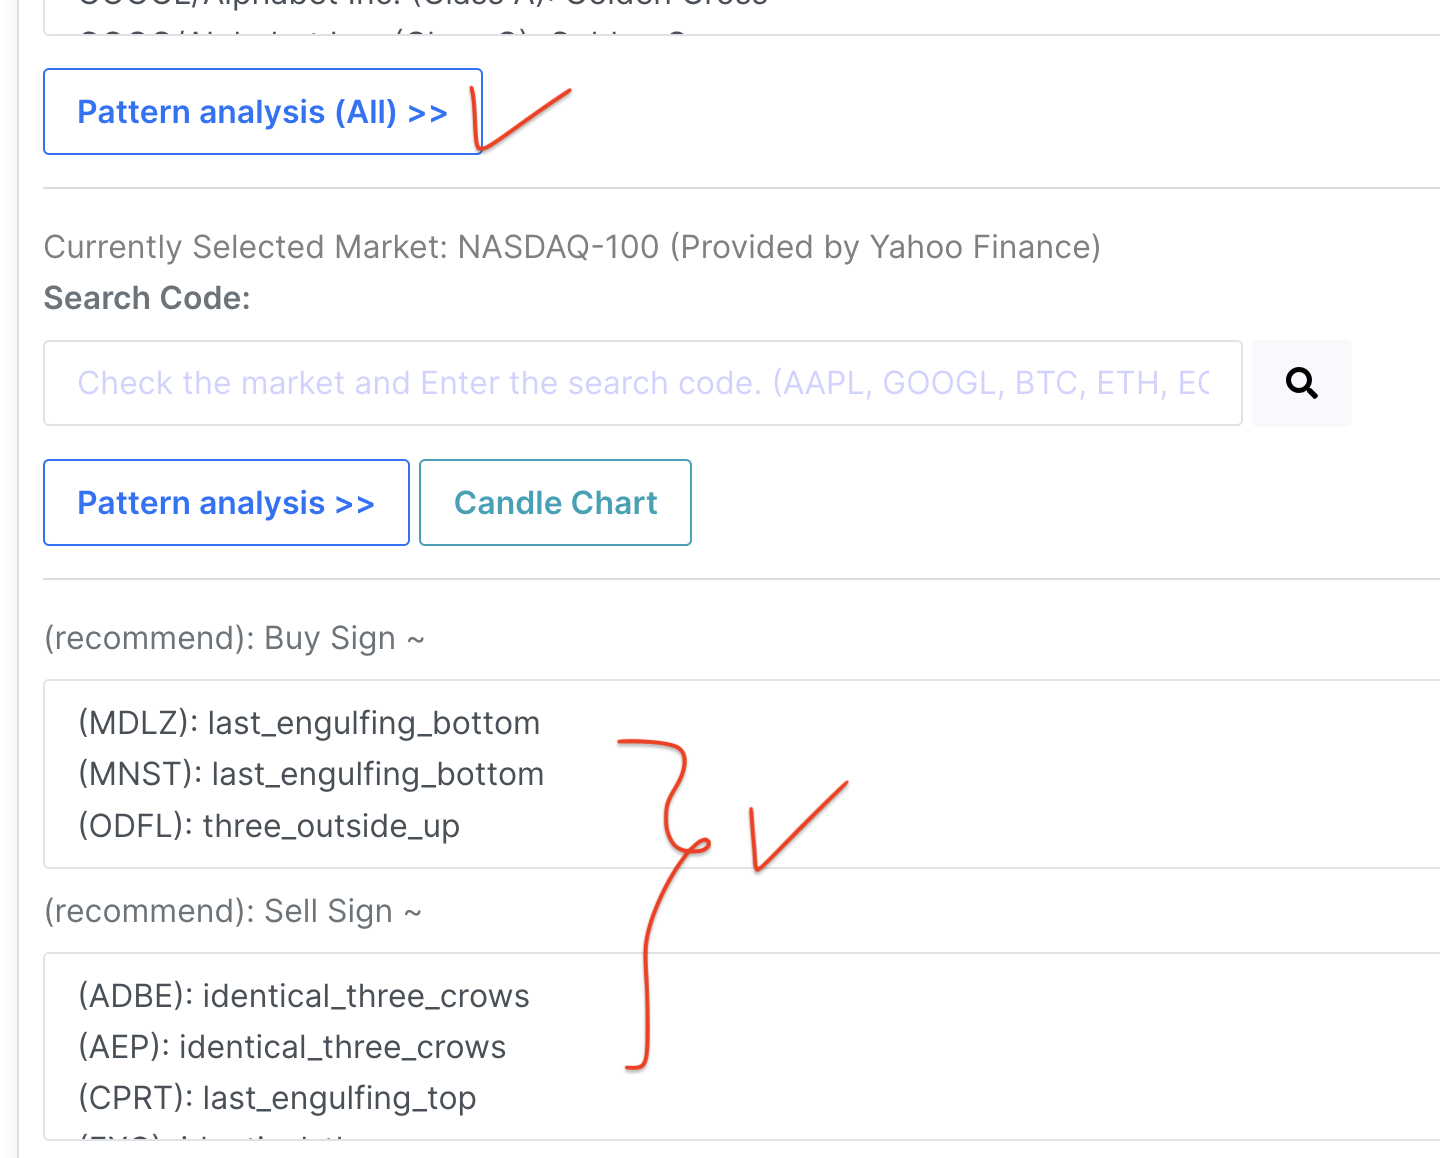
If there are items in the search results, clicking the 'Pattern analysis (All) >>' button will detect the 'chart pattern' for those items, and the 'Step 03' screen will automatically unfold, displaying the items matching the chart pattern detection based on the end date of the search period. If 'Step 03' does not unfold automatically, click 'Step 03' or check for an 'error message' at the top of the screen.
To enhance 'security', a message may appear at the top of the screen after a certain period to prompt you to log in again.
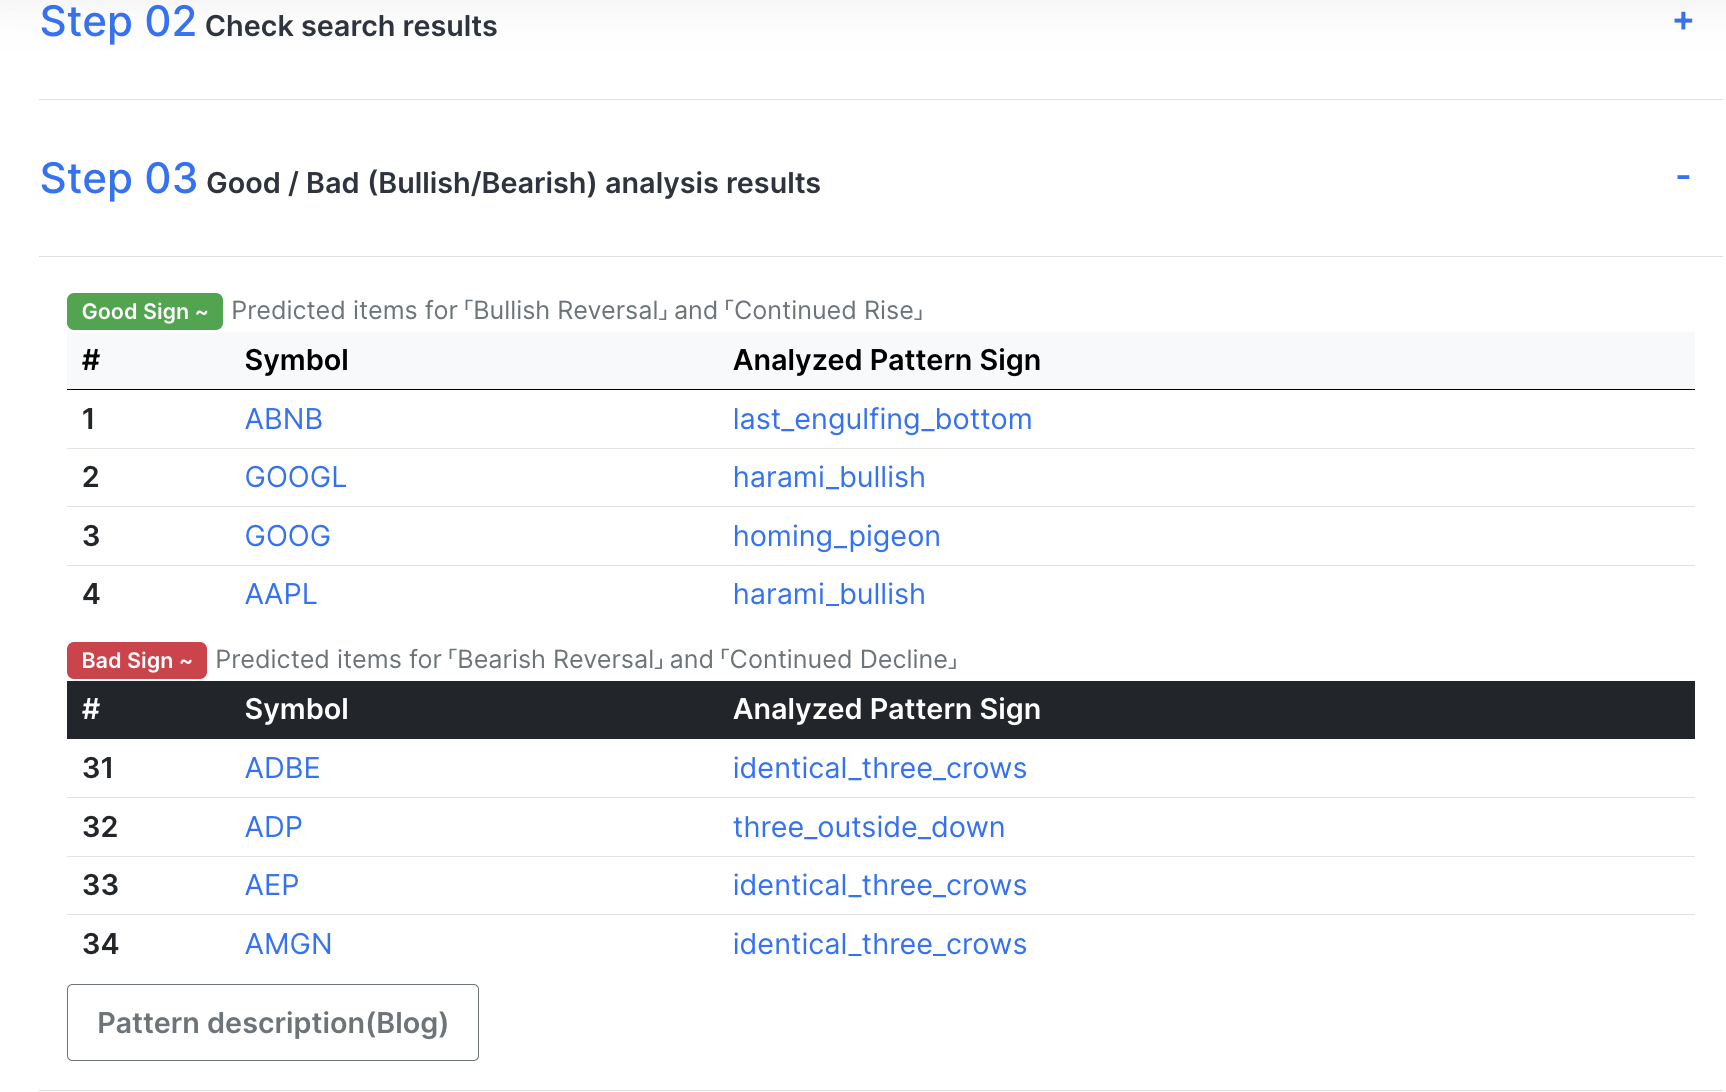
This screen displays the results of 'chart pattern detection' for all the items listed in the table format in the 'Step 02' screen at once.
The screen is displayed in two table formats, with the upper table listing items predicted to have a 'Good' Sign, indicating 'bullish reversal or continued rise', and the lower table listing items predicted to have a 'Bad' Sign, indicating 'bearish reversal or continued decline'.
If the items are listed in the table format, scrolling up and down will show more items.
If no items are displayed in the upper and lower tables, it means there are no items matching the pattern based on the 'end date' of the search period. In such cases, adjust the 'end date' of the search period at the top of the screen to check if a Sign occurred earlier.
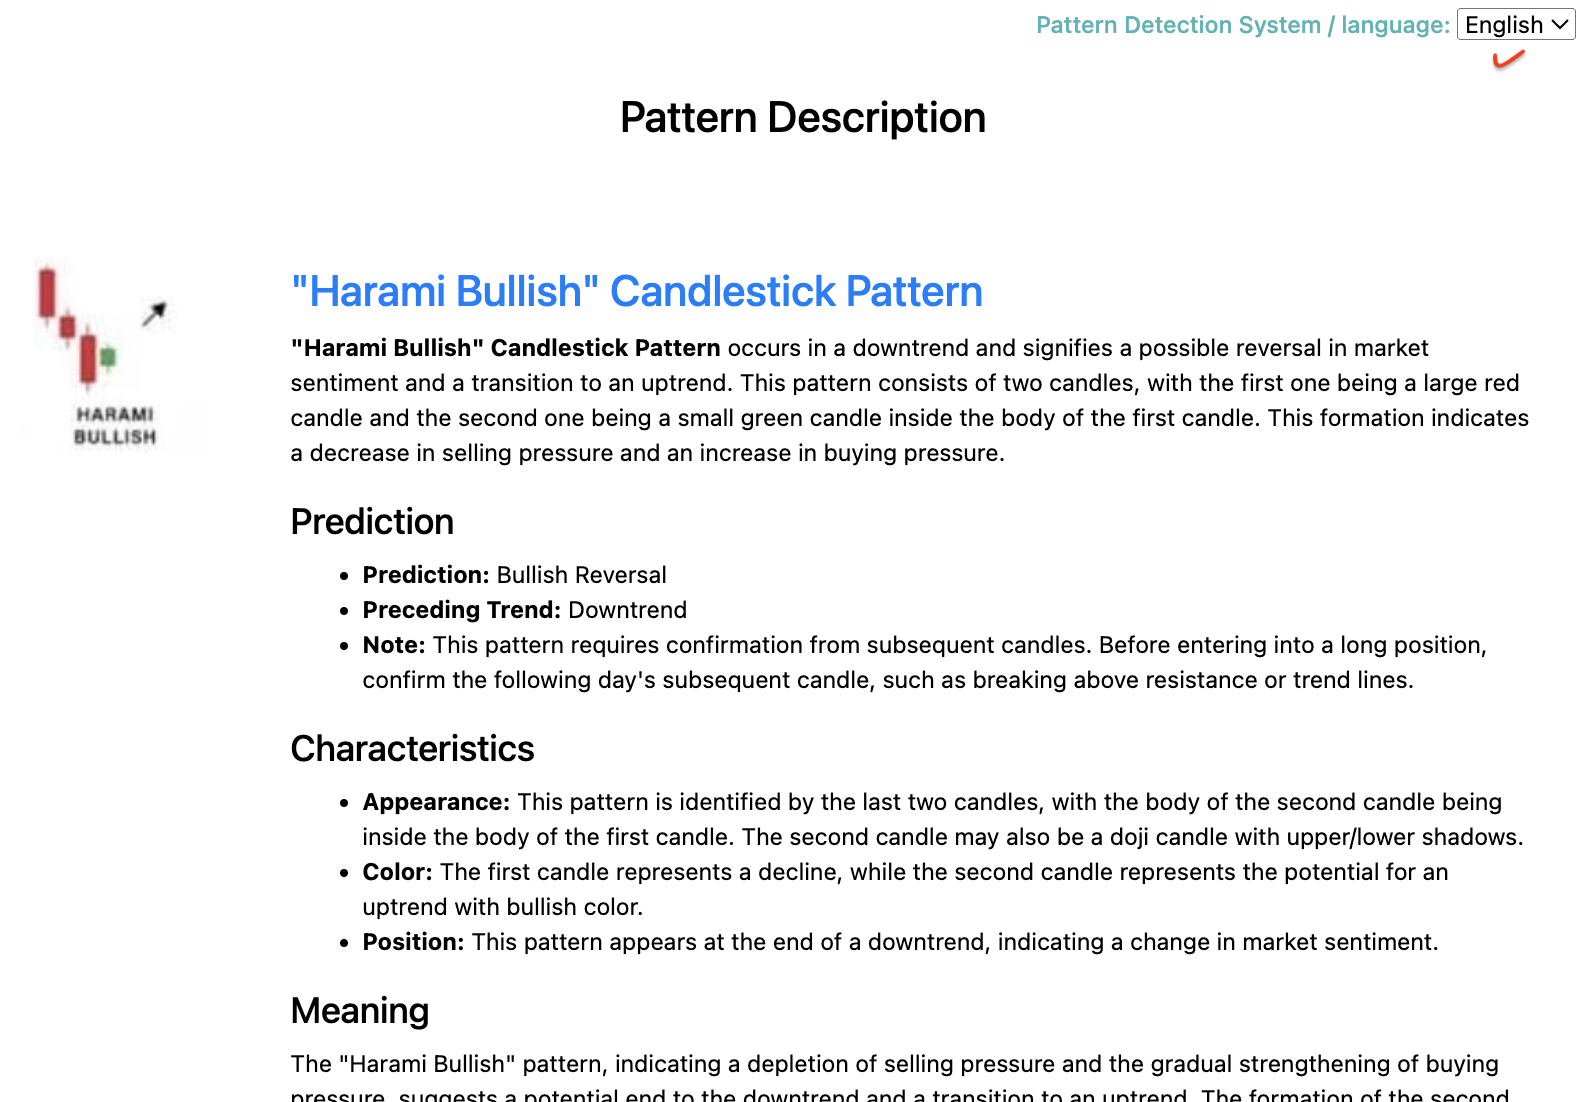
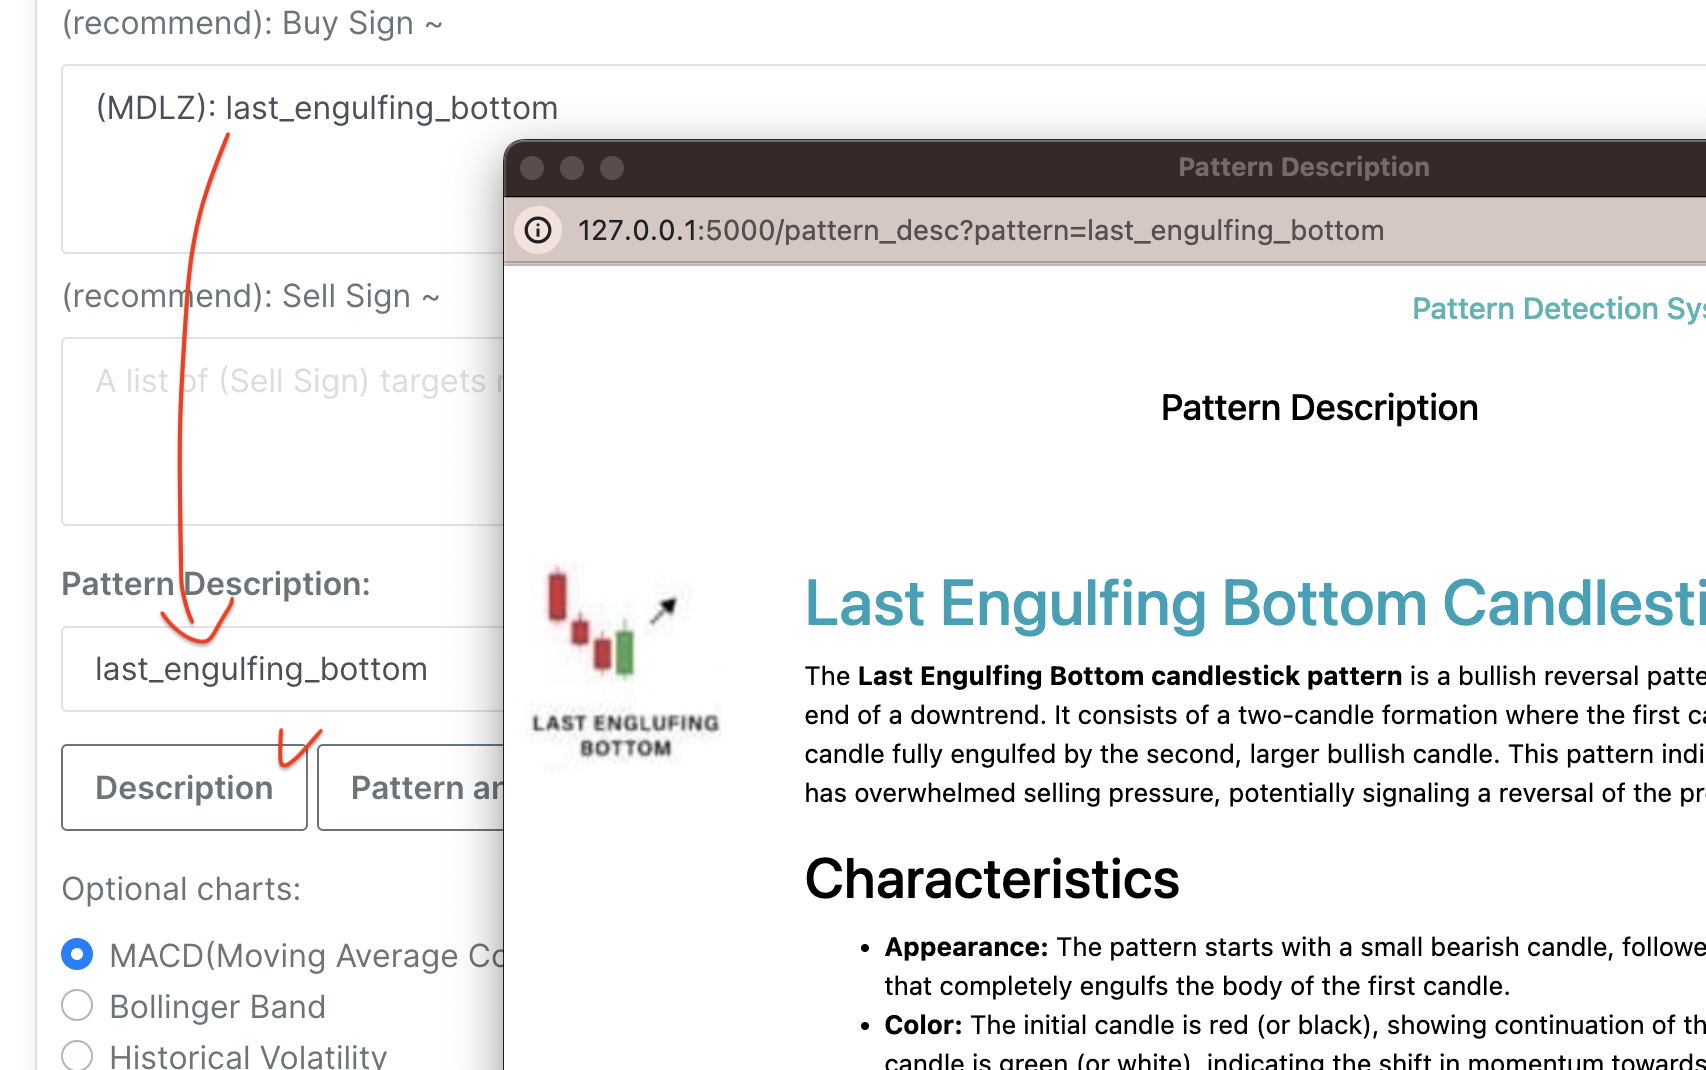
When items are displayed in each table format, the detected 'candle chart pattern name' is shown in the 'Analyzed Pattern Sign' column for each item, and clicking the pattern name will display a pop-up with predictions, characteristics, meanings, trading strategies, and prerequisites for that pattern. The pattern description is provided in English, Korean, Chinese, and Japanese. Select the 'language' at the top right of the screen.
The bottom of the pattern description pop-up screen also provides URLs to refer to descriptions from other sites. While the pattern detection logic may vary slightly between sites, our service analyzes patterns more strictly to display signals.
If you have different views on the pattern detection logic, please contact us via email, and we will thoroughly review it again.
(Note: When your browser prompts to open a pop-up window, you must allow it to open the pop-up window. If the pop-up window does not open, clear your browser cache or disable pop-up blocking in the 'settings'.)
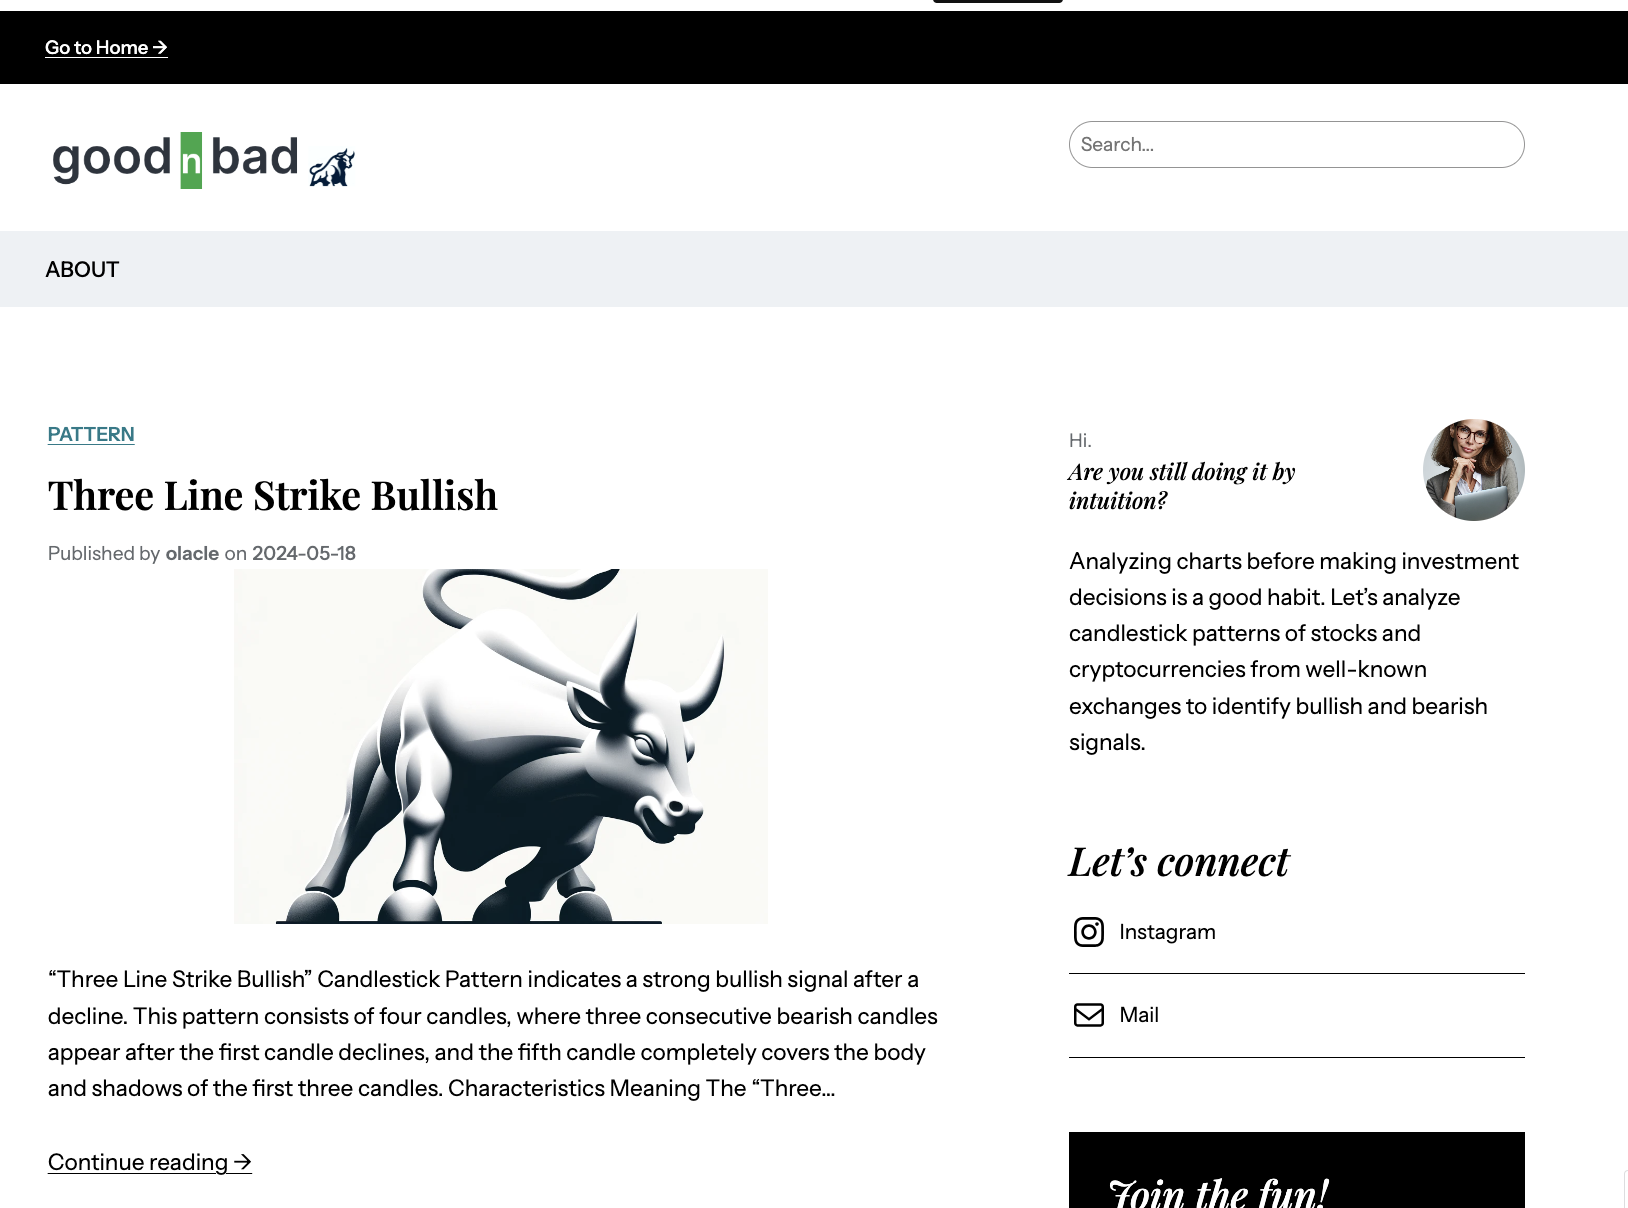
Clicking the 'Pattern description (Blog)' button below the 'Bad' Sign table will open a separate new browser window with a blog site that provides descriptions of all patterns automatically detected by our service. If the blog site opens in a new browser window and our service screen disappears, don't panic. Close the blog to see our service screen again.
Currently, the blog site is provided in English and Korean. It is provided in English or Korean depending on the selected language of your browser.
(The blog site will soon include additional content on technical chart analysis.)
Additionally, clicking the 'Symbol' of the item in the table format will automatically unfold the 'Step 04' screen, moving to the 'Candle Chart' of that item. (Refer to the 'Step 04' screen guide.)
If 'Step 04' does not unfold automatically, click 'Step 04' or check for an 'error message' at the top of the screen.
To enhance 'security', a message may appear at the top of the screen after a certain period to prompt you to log in again.
Step 04: View Chart and Single Item Pattern Analysis
Item Selection Box
This screen is available to all users, allowing you to detect patterns and analyze charts for a single item.
Additionally, clicking the 'Symbol' in the table format in the 'Step 02' or 'Step 03' screen will automatically unfold this screen, displaying the 'Candle Chart' of that item.
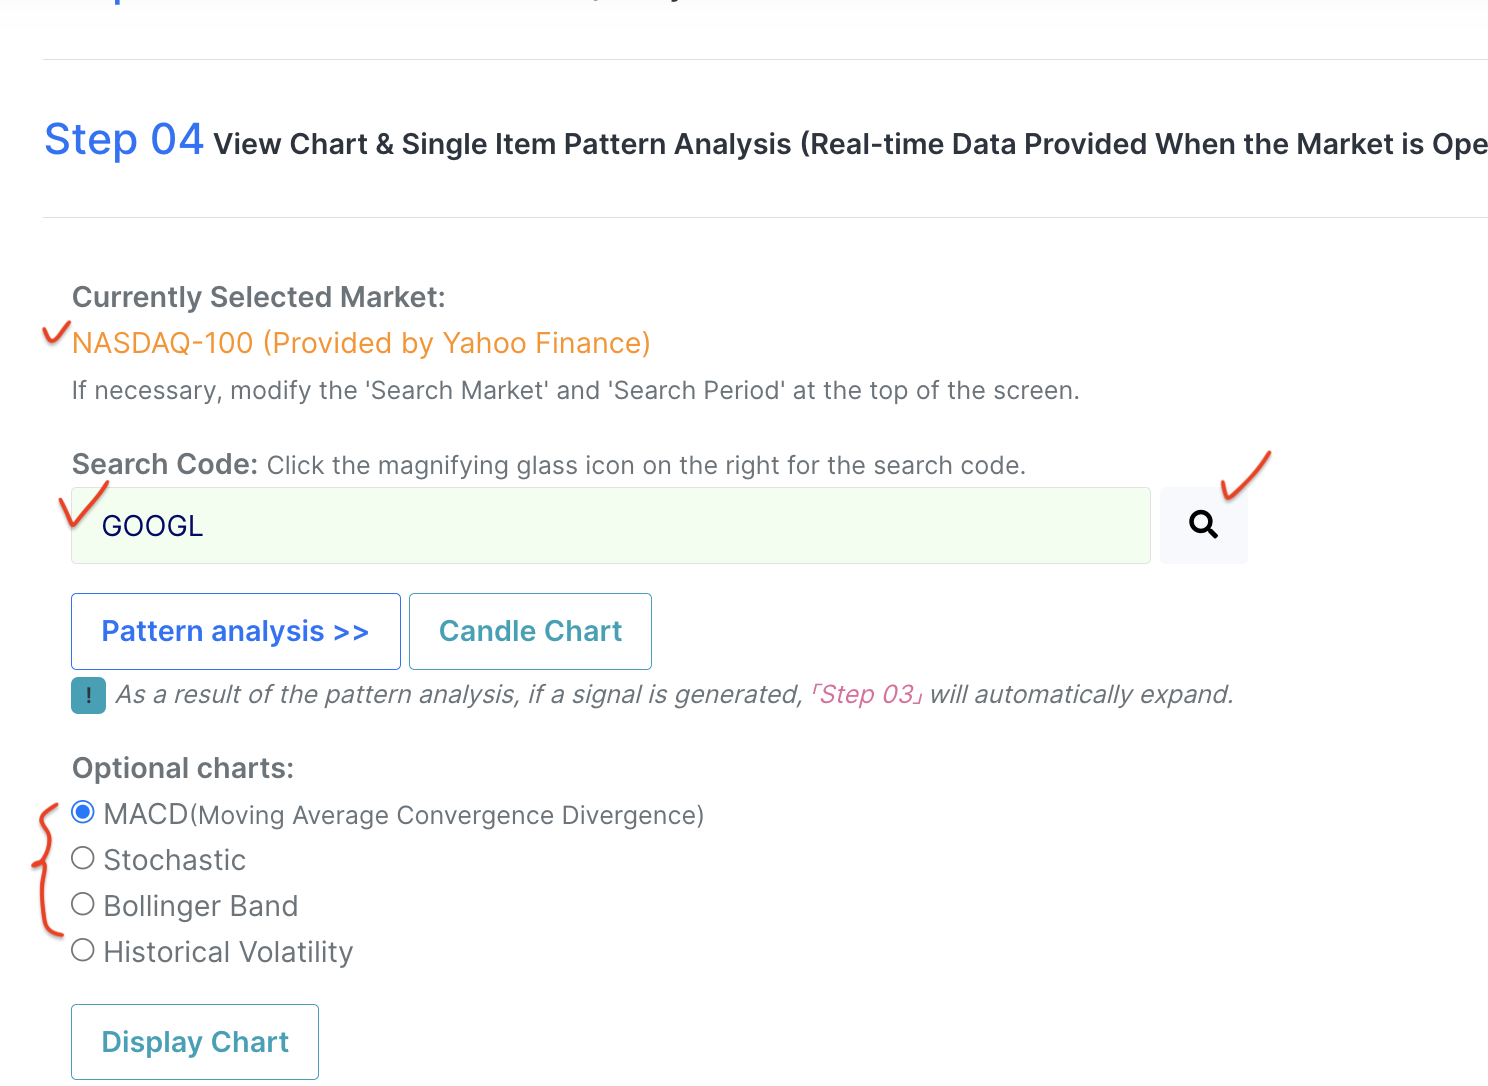
The most important thing in this step is to check the 'currently selected search market' displayed right above before proceeding with pattern detection and chart analysis. The selected item may exist in the same item code in a completely different search market.
If necessary, modify the 'search market' and 'search period' at the top of the screen.
In this step, pattern detection and chart analysis are performed only for a single item.
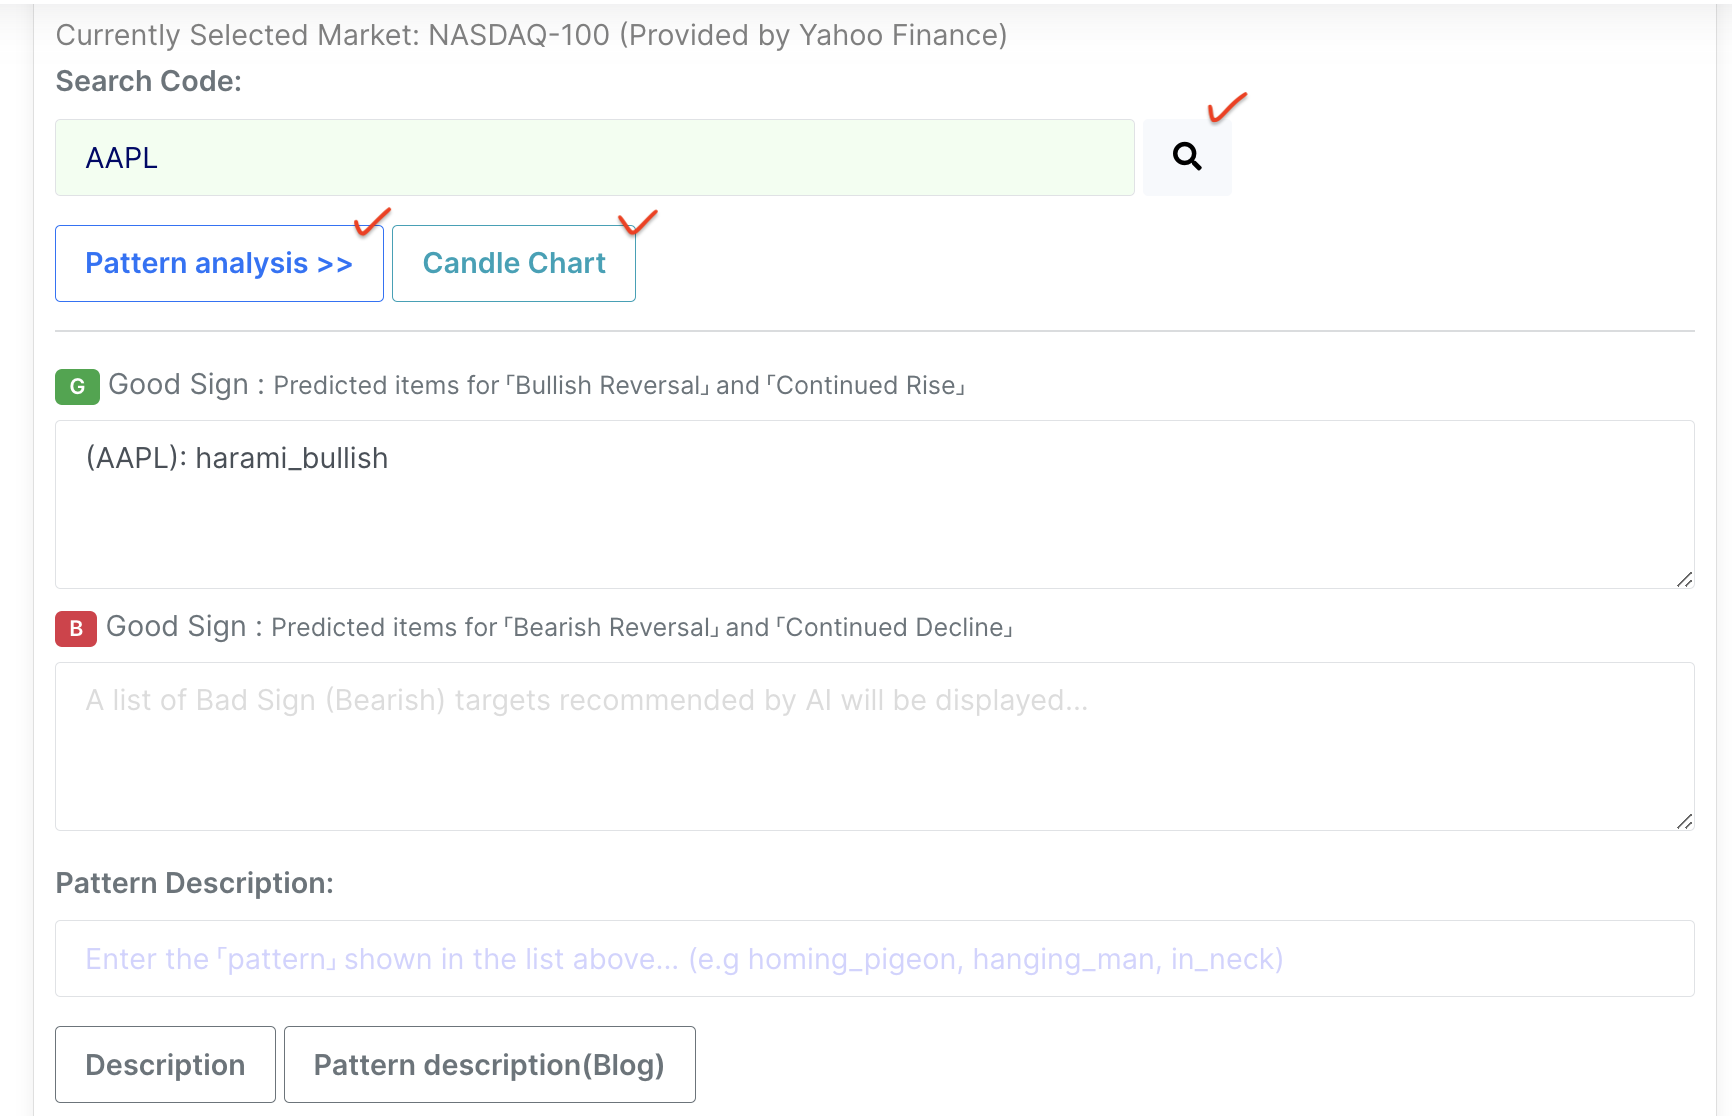
To do this, you must first enter the search code (Search Code/Symbol) in the 'light green background input field'.
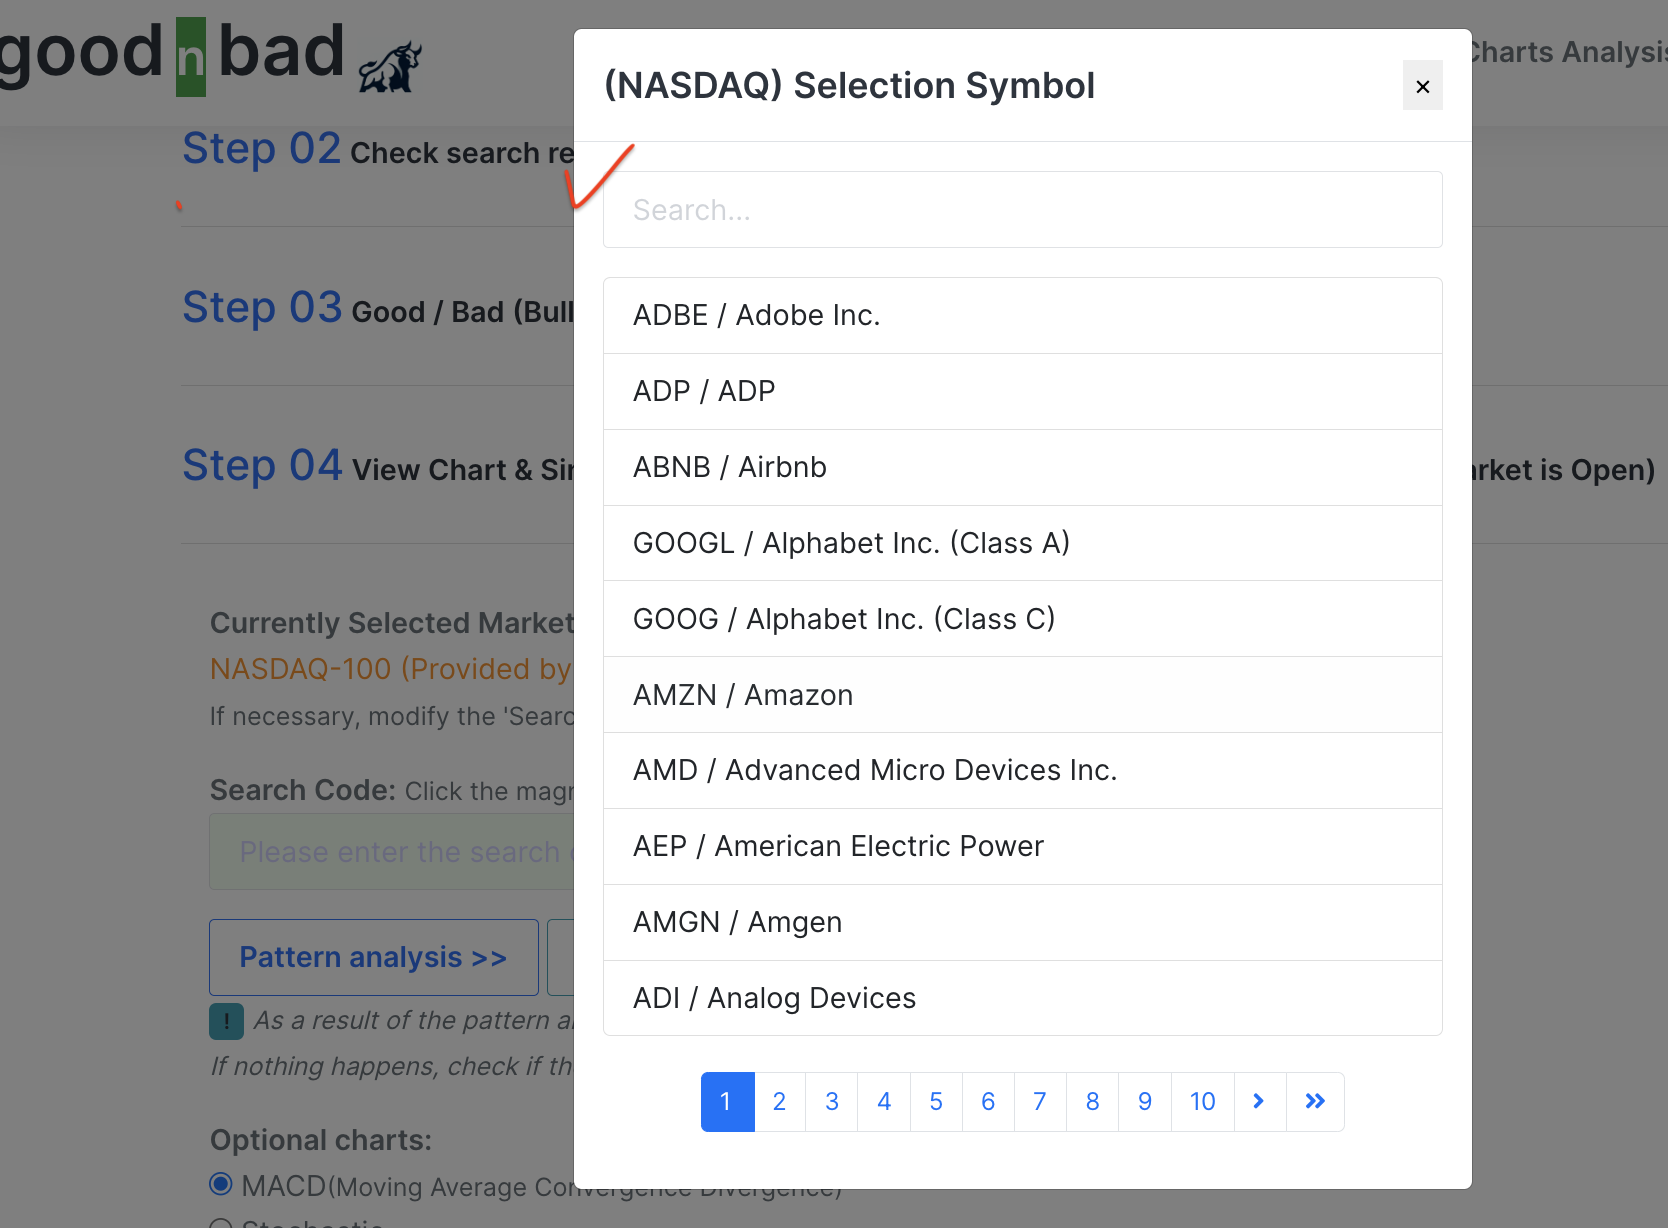
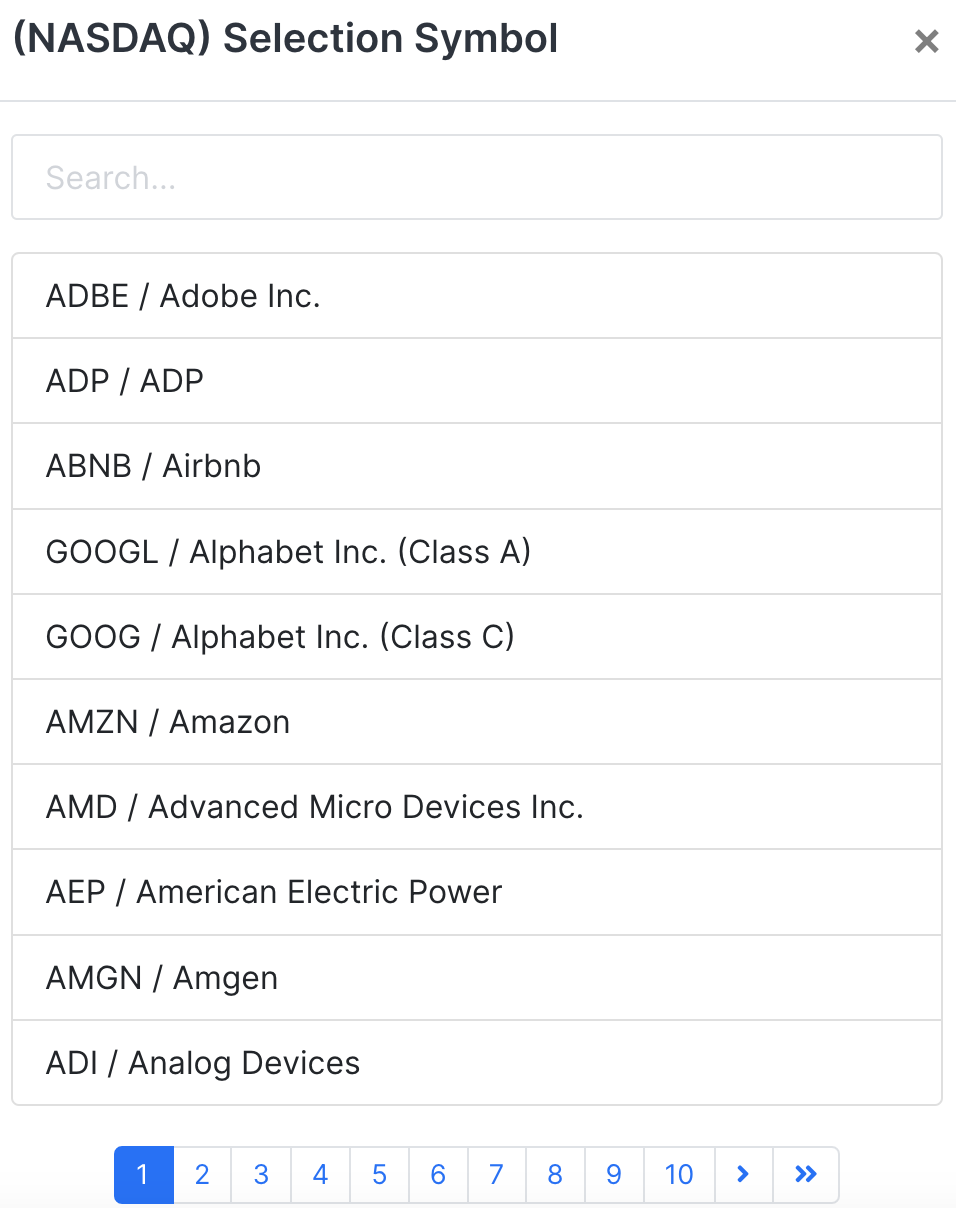
If you don't know the search code, click the 'magnifying glass' icon located on the right side of the input field, then select the search code from there.
(Be careful not to include spaces, although case sensitivity does not matter.)
You can also search for an item by entering part of the item name in the input field at the top of the 'Item Selection Box'. Select the desired item when it appears.
After entering the search code, clicking the 'Pattern analysis >>' button will perform 'chart pattern detection' for that item, and if patterns are detected, the 'Step 03' screen will automatically unfold, displaying the item in the 'Good Sign ~' table or 'Bad Sign ~' table. (Refer to the 'Step 03' screen guide.)
If the entered item does not match the 'chart pattern detection' based on the end date of the selected search period, the 'Step 03' screen will not unfold, and an 'information pop-up window' will appear instead. In this case, adjust the 'end date' of the search period at the top of the screen to check if a Sign occurred earlier.
If 'Step 03' does not unfold automatically without an 'information pop-up window', click 'Step 03' or check for an 'error message' at the top of the screen.
To enhance 'security', a message may appear at the top of the screen after a certain period to prompt you to log in again.
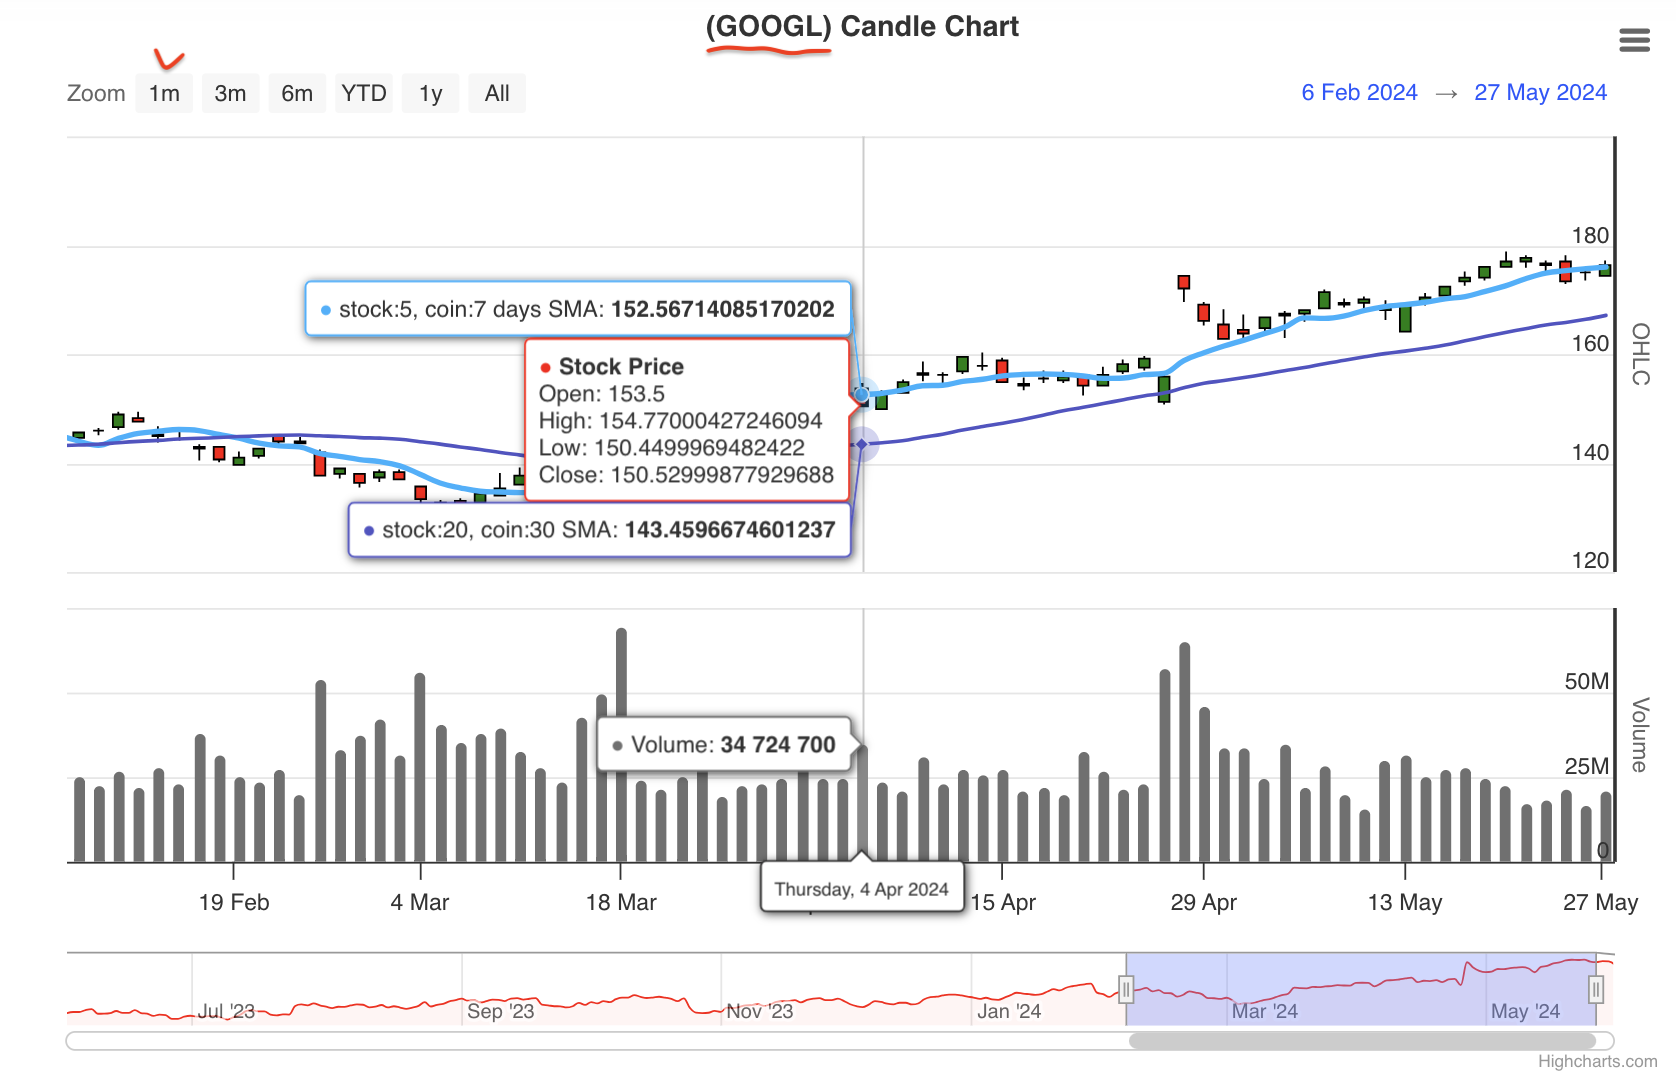
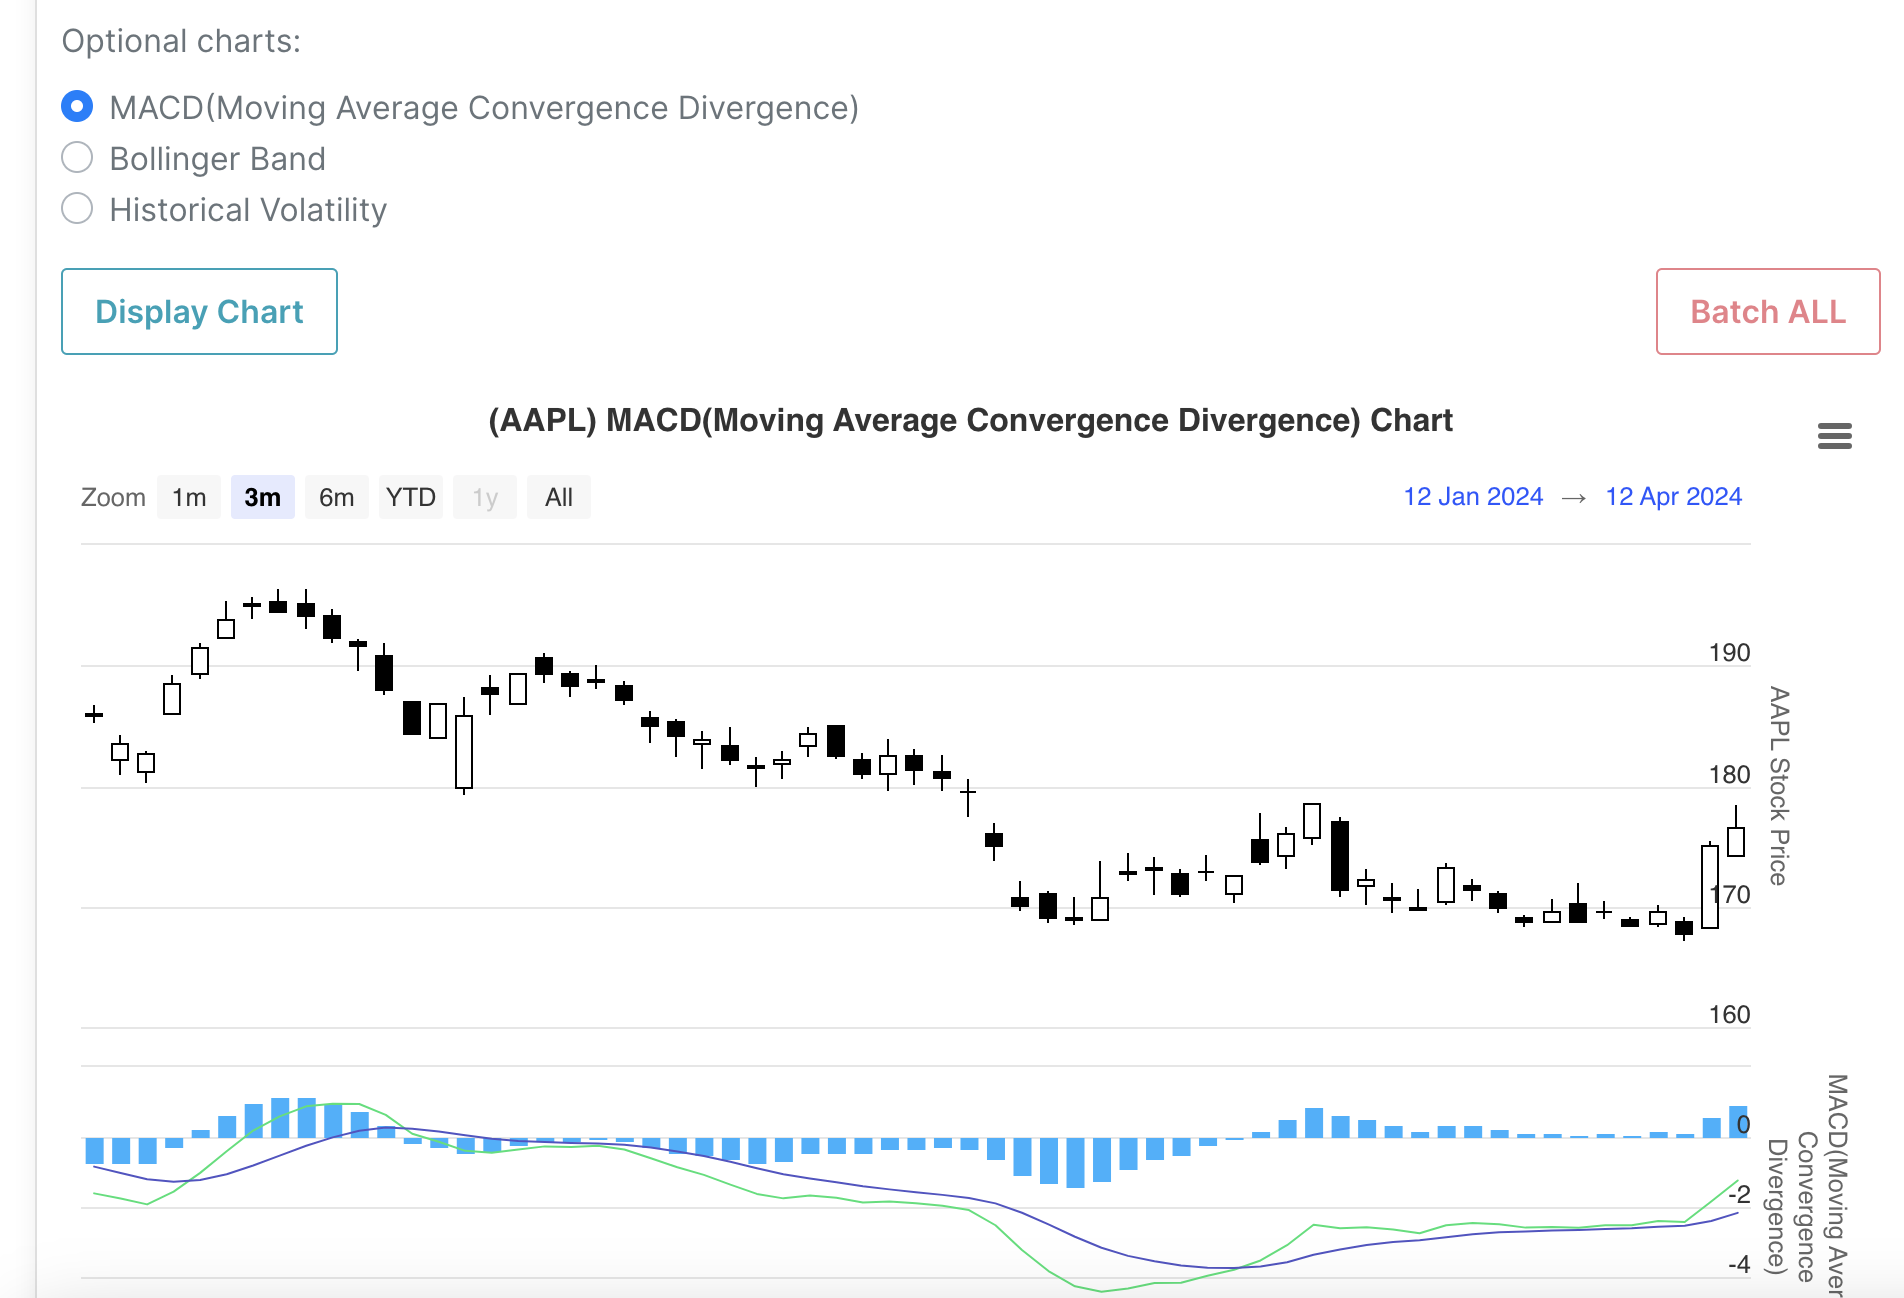
After entering the search code, clicking the 'Candle Chart' button will display the 'candlestick chart' of that item below the screen.
Confirm that the 'item code' of the candlestick chart matches the selected search code,
and check if the appearance of the last candlesticks in the candlestick chart matches the 'pattern description' we provide.
Although our service informs you of 'Sign' for chart pattern detection, it does not recommend 'buy/sell'. 'Buy/sell' should be determined by your judgment, so please keep this in mind. It is also a good habit to check other 'auxiliary charts' before 'buy/sell'. After selecting the 'MACA', 'Stochastic', 'Bollinger Band', 'Historical Volatility', etc. 'auxiliary charts' we provide,
click 'Display Chart' to use them.
Instead of relying solely on the candlestick pattern detection results, it is good to check other charts as auxiliary reference materials before making a decision.
1. Select auxiliary charts such as MACD, Bollinger Band, etc., and click the 'Display Chart' button.
2. If there is a stock or cryptocurrency code in the 'symbol' input field, the chart will be displayed in the lower area. (Make sure the target market matches.)
Check Other Auxiliary Charts
Sign Up
You can quickly explore as a guest user by clicking the 'Guest Login' button on this screen or the Home screen, but access may be interrupted due to many users logging in simultaneously. It is insufficient for continuous use. Try signing up for a free membership. You can use general features except for premium features.
After logging in, you will automatically move to the Step-by-Step chart pattern detection screen. Clicking the 'Advanced Page' at the top of the screen will move to a screen where you can use the functions on one screen as shown on the side screen.
Select Pattern Analysis Menu
Select Advanced Page
Chart Pattern Detection and Chart Analysis Screen
Search Section
This section is where you search all stocks and cryptocurrencies based on the selected conditions.
1. Select the search market and search period.
2. You can select additional options such as 'Golden Cross' and 'Dead Cross'.
3. Basic indicators (PER, PBR, etc.) apply only to stocks. To search regardless of indicator values, select 'All'.
4. Click the 'Search' button to display the relevant stocks and cryptocurrencies below.
The searched stocks and cryptocurrencies are analyzed for dozens of patterns such as 'Hammer', 'Hanging Man', and the signals 'Bullish (Buy)' and 'Bearish (Sell)' are displayed in the list below. (Provided only to premium members.)
"Pattern Analysis (All)"
Individual Stock and Cryptocurrency Pattern Detection
Selection Box
Don't worry. Even if you don't have a premium account, you can perform pattern detection for individual stocks and cryptocurrencies.
1. Select the target market and search period. (The 'end date' of the search period is used as the reference date for pattern analysis, so it is important.)
2. Enter the stock code (AAPL, GOOGL, etc.) or cryptocurrency code (BTC, ETH, EOS, etc.) in the 'search code' section. If you don't know the code, click the 'magnifying glass' icon on the right to select from the selectbox pop-up screen.
3. Verify that the entered code is in the 'search market' because pattern analysis can only be performed for the entered code in the selected search market. The selected 'search market' is displayed above the code entry section.
4. Click the 'Chart Pattern Detection >>' button to analyze dozens of patterns such as 'Hammer', 'Hanging Man' for the entered (selected) code and display 'bullish' and 'bearish' signals in the list below. (Provided to all members.)
5. Clicking the 'Candle Chart' button will display the 'candlestick chart' of the code in the 'search code' section below the screen. You can check the detected patterns in the 'candlestick chart', and learn about the patterns with the description based on the last day's candlesticks.
In this section, you can enter the pattern name and click the 'Candle Description' button to display a pop-up with the description of the candle pattern. You can copy and paste the pattern name detected in the 'Signal' section above or enter it directly. Enter the word accurately, and include '_' between words for compound terms.
The bottom of the pattern description pop-up screen also provides URLs to refer to descriptions from other sites. While the pattern detection logic may vary slightly between sites, our service analyzes patterns more strictly to display signals.
If you have different views on the pattern detection logic, please contact us via email, and we will thoroughly review it again.
View Candle Pattern Description
Check Other Auxiliary Charts
Instead of relying solely on the candlestick pattern detection results, it is good to check other charts as auxiliary reference materials before making a decision.
1. Select auxiliary charts such as MACD, Bollinger Band, etc., and click the 'Display Chart' button.
2. If there is a stock or cryptocurrency code in the 'symbol' input field, the chart will be displayed in the lower area. (Make sure the target market matches.)
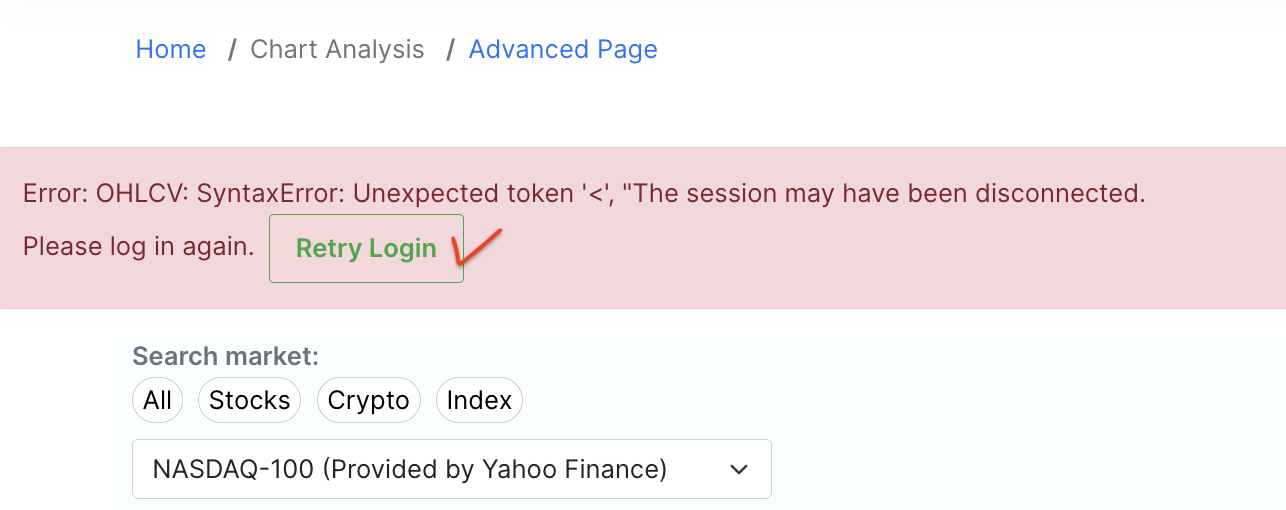
To enhance 'security', a message may appear at the top of the screen to prompt you to log in again after a certain period has elapsed, as shown on the side screen. Most of the time, the screen will automatically scroll to the top so you can see the message, but depending on the characteristics of the browser, the focus may not move. If the results do not appear or the screen does not seem to work, check the message at the top of the screen and click 'Retry Login' to log in again before using it.
'Retry Login' Message
Our service does not provide trading functions. In the future, only pattern analysis information will be provided.
Please use other services for direct trading. We are continually adding auxiliary charts, and you can check them through third-party apps/web services you are subscribed to.
