Do you still trade by intuition?
Bullish/Bearish signs by analyzing candlestick chart patterns of stocks and cryptos in famous markets
Window Rising 348.91 +1.48%
Hanging Man, High Wave 1,516,000 +1.95%
High Wave 4,380 +1.27%
Hikkake Bearish 5,885 -3.49%
More than 5,000 stocks and cryptocurrencies in major markets
Check more than 70 candlestick patterns in the markets you follow, as one input to your buy/sell decisions.

Pattern detection by symbol
Pick a stock or cryptocurrency and check its bullish/bearish pattern signals with the latest prices.

Bulk-batch pattern detection (paid · coming soon)
A paid feature that shows bullish/bearish pattern signals for all stocks and cryptocurrencies in the selected market at once. Paid plans are not open yet.

Implement your ideas (coming soon)
We are preparing a service that turns your own pattern-detection idea into a program for you. (For your use only)

Share your pattern (coming soon)
We are preparing a feature that lets you share your own patterns with other members and split the revenue.
General Users.
The level that anyone can obtain after completing FREE membership registration is limited, but some service functions are limited.
Premium Users (coming soon).
Paid plans are not open yet. When they launch, this paid level will give access to most of the service's features, including:

Check a symbol quickly
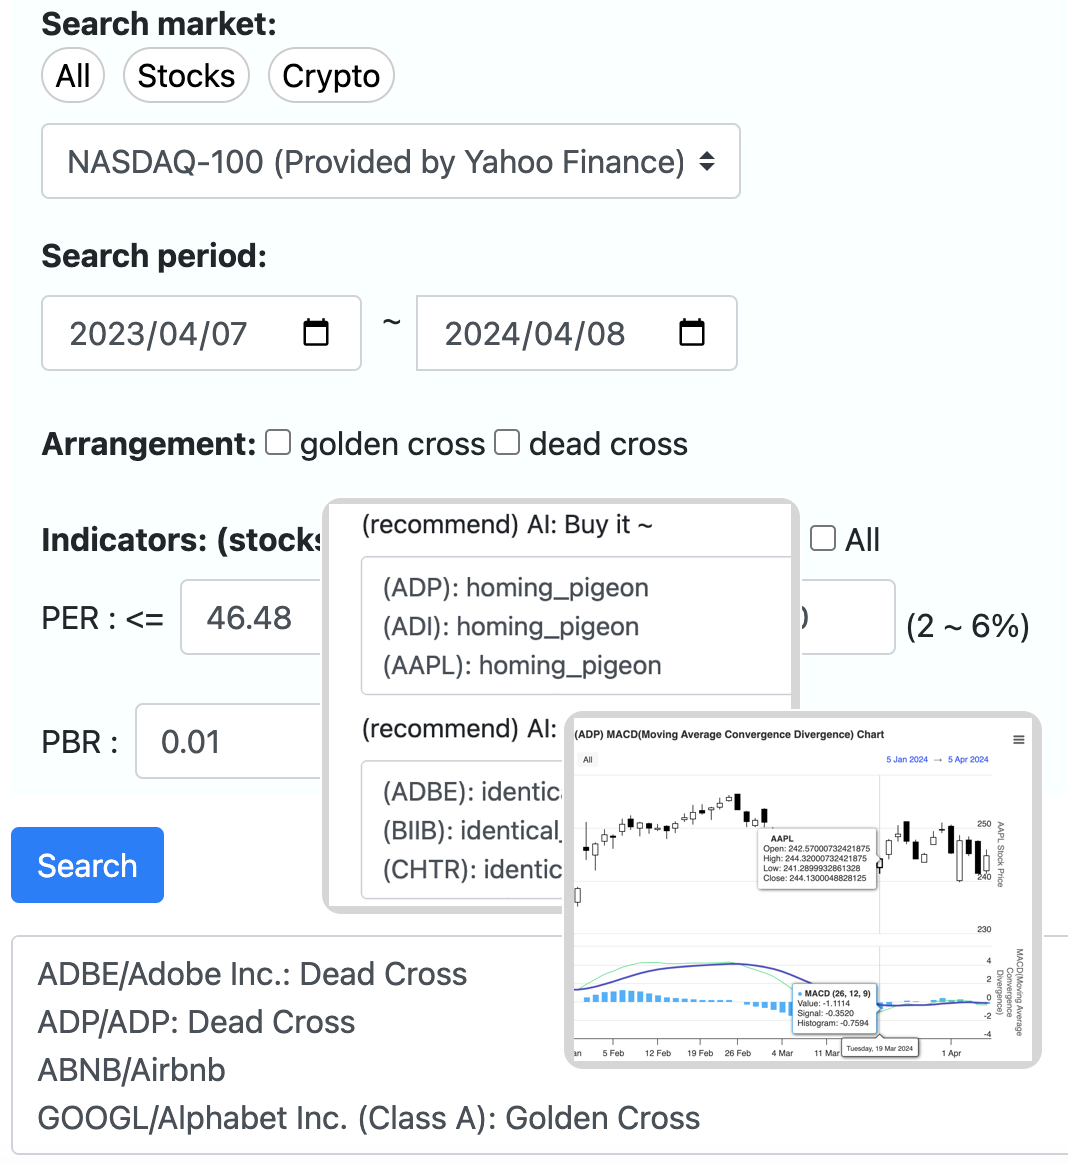
Enter a ticker or a name to see the candlestick pattern signals on the latest bars, together with the chart. Each pattern, such as 'Hammer' or 'Kicking Bullish', has its own explanation page.
Example 1
Pattern check by symbolCharts and indicators on one screen
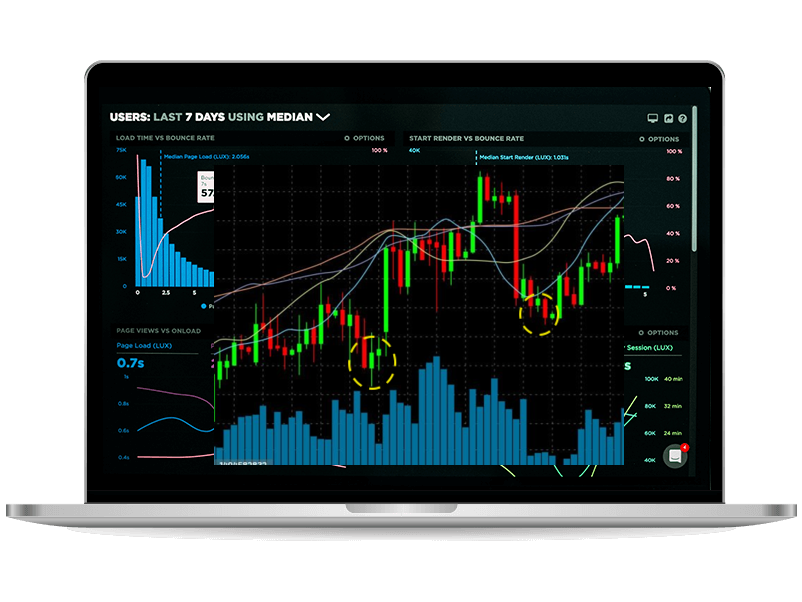
Overlay moving averages, MACD, Bollinger Bands and other indicators on the candlestick chart, and download it as an image or a CSV file. Signals are for reference only — combine them with your own analysis.
Example 2
Charts and indicatorsCheck candlestick patterns across major markets in one place.